Từ Điển Lean Six Sigma
100 thuật ngữ chuyên ngành Lean Six Sigma, TPM, TQM, 5S/6S Kaizen
A (100)
| English | Tiếng Việt |
|---|---|
| Advanced Lean Accounting | Predictive Costing |
| Advanced Lean Accounting: Predictive Costing | Advanced Lean Accounting: Predictive Costing |
📂 Lean
| English | Tiếng Việt |
|---|---|
| Adverse event | 4 giờ |
| Adverse event | 5 ngày xử lý | 4 giờ | Adverse event | 5 ngày xử lý | 4 giờ |
📂 General
| English | Tiếng Việt |
|---|---|
| Aerospace | 5-12% |
| Aerospace | 5-12% | < 5% | 15-25% | Aerospace | 5-12% | < 5% | 15-25% |
📂 General
| English | Tiếng Việt |
|---|---|
| Affinity Diagram | Biểu đồ quan hệ |
| Organizing a large number of ideas into natural groupings based on their relationship. | Sắp xếp một lượng lớn ý tưởng thành các nhóm tự nhiên dựa trên mối quan hệ của chúng. |
📂 New 7 Management Tools
| English | Tiếng Việt |
|---|---|
| Aggregate data | Dữ liệu tổng hợp |
| Essentially summary data, Minitab will create columns of aggregate data as a storage option for tables commands and logistic regression analyses. In logistic regression, these columns summarize the number of trials and/or occurrences of each factor/covariate pattern. | Định nghĩa dữ liệu tóm tắt, Minitab sẽ tạo cột dữ liệu tổng hợp như một lựa chọn lưu trữ cho các lệnh bảng và phân tích hồi quy logistic. Trong hồi quy logistic, các cột này tóm tắt số lần thử nghiệm và/hoặc sự xuất hiện của mỗi mẫu hình yếu tố/thay đổi. |
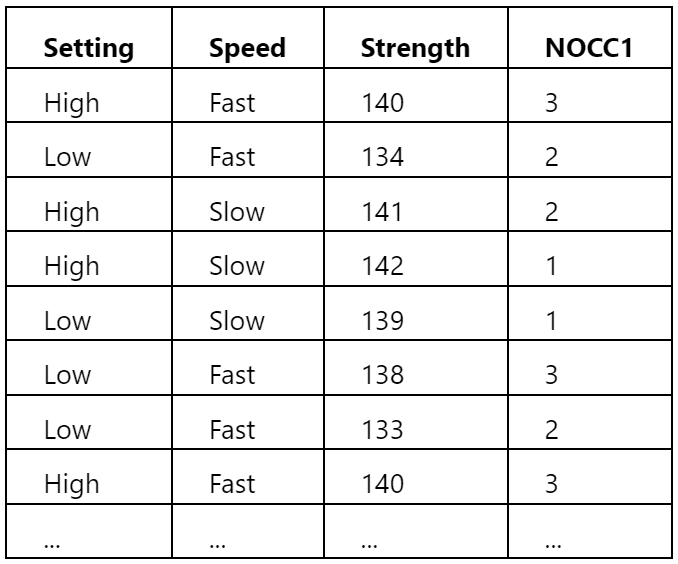
| For example, a binary logistic regression analysis was performed on this data, and Number of occurrences of the event was chosen as a storage option. This resulted in the creation of a column of aggregate data stored in NOCC1. From the first row, NOCC1 tells us that the combination of High Setting, Fast Speed, and Strength of 140 occurred three times in this data set. | Ví dụ, một phân tích hồi quy logistic nhị phân được thực hiện trên dữ liệu này, và Số lần xuất hiện của sự kiện đã được chọn là một lựa chọn lưu trữ. Điều này dẫn đến việc tạo ra một cột dữ liệu tổng hợp được lưu trữ trong NOCC1. Từ dòng đầu tiên, NOCC1 cho chúng ta biết rằng kết hợp của Thiết lập Cao, Tốc độ Nhanh và Sức mạnh là 140 đã xuất hiện ba lần trong tập dữ liệu này. |
| English | Tiếng Việt |
|---|---|
| Agile | Lean |
| Agile–Lean–Six Sigma Hybrid, Design Thinking, Scrum for Continuous Improvement | Agile–Lean–Six Sigma Hybrid, Design Thinking, Scrum for Continuous Improvement |
📂 Lean
| English | Tiếng Việt |
|---|---|
| Agile Manifesto | Tuyên ngôn Agile |
| A document outlining the four core values and twelve principles of Agile software development. | Tài liệu trình bày bốn giá trị cốt lõi và mười hai nguyên tắc phát triển phần mềm Agile. |
📂 Agile/Scrum/Kanban
| English | Tiếng Việt |
|---|---|
| AI Chatbot | 100-300 triệu |
| AI Chatbot | 100-300 triệu | 500 triệu-1 tỷ | 6 tháng | AI Chatbot | 100-300 triệu | 500 triệu-1 tỷ | 6 tháng |
📂 AI/Digital
| English | Tiếng Việt |
|---|---|
| AI Engine | GPT-4 / Claude / Custom |
| AI Engine | GPT-4 / Claude / Custom | Content generation, chatbot, analytics | AI Engine | GPT-4 / Claude / Custom | Content generation, chatbot, analytics |
📂 AI/Digital
| English | Tiếng Việt |
|---|---|
| AI Integration | Native (200+ apps) |
| AI Integration | Native (200+ apps) | Add-on | None | AI Integration | Native (200+ apps) | Add-on | None |
📂 Six Sigma
| English | Tiếng Việt |
|---|---|
| AI Maintenance | 80M VND |
| AI Maintenance | 80M VND | 200M VND | 250% | AI Maintenance | 80M VND | 200M VND | 250% |
📂 AI/Digital
| English | Tiếng Việt |
|---|---|
| AI Model Training | Huấn luyện Mô hình AI |
| The process of feeding data to algorithms so they can learn to make predictions or decisions. | Quy trình cung cấp dữ liệu cho thuật toán để chúng có thể học cách đưa ra dự đoán hoặc quyết định. |
📂 AI / Machine Learning in Manufacturing
| English | Tiếng Việt |
|---|---|
| AI PdM | 500 triệu-1 tỷ |
| AI PdM | 500 triệu-1 tỷ | 1-3 tỷ | 18 tháng | AI PdM | 500 triệu-1 tỷ | 1-3 tỷ | 18 tháng |
📂 AI/Digital
| English | Tiếng Việt |
|---|---|
| AI Quality | 50M VND |
| AI Quality | 50M VND | 150M VND | 300% | AI Quality | 50M VND | 150M VND | 300% |
📂 Quality Management
| English | Tiếng Việt |
|---|---|
| AI Root Cause Analysis | 30-100 triệu |
| AI Root Cause Analysis | 30-100 triệu | 1-3 tháng | Dễ | AI Root Cause Analysis | 30-100 triệu | 1-3 tháng | Dễ |
📂 Problem Solving
| English | Tiếng Việt |
|---|---|
| AI Vision QC | 150-500 triệu |
| AI Vision QC | 150-500 triệu | 3-6 tháng | Trung bình | AI Vision QC | 150-500 triệu | 3-6 tháng | Trung bình |
📂 AI/Digital
| English | Tiếng Việt |
|---|---|
| AI-Powered Robotics | Robot được hỗ trợ bởi AI |
| Robots enhanced with AI capabilities for adaptive, intelligent manufacturing operations. | Robot được nâng cấp với khả năng AI cho các hoạt động sản xuất thích ứng và thông minh. |
📂 AI / Machine Learning in Manufacturing
| English | Tiếng Việt |
|---|---|
| AI/Machine Learning | Autonomous learning, prediction, decision |
| AI/Machine Learning | Autonomous learning, prediction, decision | Visual inspection, process optimization, scheduling | AI/Machine Learning | Autonomous learning, prediction, decision | Visual inspection, process optimization, scheduling |
📂 AI/Digital
| English | Tiếng Việt |
|---|---|
| AI/ML predictive | 99%+ |
| AI/ML predictive | 99%+ | Very high | Advanced, predictive OEE | AI/ML predictive | 99%+ | Very high | Advanced, predictive OEE |
📂 TPM
| English | Tiếng Việt |
|---|---|
| AIAG (Automotive Industry Action Group) | AIAG (Tập đoàn Hành động Công nghiệp Ô tô) |
| A global organization founded by managers from DaimlerChrysler, Ford Motor Company, and General Motors in 1982 with the purpose of providing an open forum for sharing information benefiting the automotive industry. Today, there are more than 1600 member companies which cooperate in developing and sharing solutions that enhance the prosperity of the automotive industry. | Một tổ chức toàn cầu được thành lập bởi các quản lý đến từ DaimlerChrysler, Ford Motor Company và General Motors vào năm 1982 với mục đích cung cấp một diễn đàn mở để chia sẻ thông tin có lợi cho ngành công nghiệp ô tô. Ngày nay, có hơn 1600 công ty thành viên hợp tác trong việc phát triển và chia sẻ các giải pháp nhằm nâng cao sự thịnh vượng của ngành công nghiệp ô tô. |
| The AIAG publishes reference materials aimed at improving the quality of products and are used by many suppliers and manufacturers, not just those in automotive industries. Among them, the Measurement System Analysis manual and the Statistical Process Control manual have been used by many quality practitioners to improve their processes. | AIAG xuất bản các tài liệu tham khảo nhằm cải thiện chất lượng sản phẩm và được sử dụng bởi nhiều nhà cung cấp và nhà sản xuất, không chỉ trong ngành công nghiệp ô tô. Trong số đó, Hướng dẫn Phân tích Hệ thống Đo lường và Hướng dẫn Kiểm soát Quy trình Thống kê đã được nhiều người thực hành chất lượng sử dụng để cải thiện quy trình của họ. |
| Several Minitab commands, including Gage Linearity and Bias Study and Gage R&R Study (Crossed) are developed using these manuals. | Một số lệnh Minitab, bao gồm nghiên cứu Độ thẳng và Sai lệch của Dụng cụ đo và nghiên cứu R&R của Dụng cụ đo (Xuyên) được phát triển bằng cách sử dụng các hướng dẫn này. |
| For more information, see www.aiag.org. | Để biết thêm thông tin, xem trang web www.aiag.org. |
Xem thêm: Tài liệu tham khảo liên quan
| English | Tiếng Việt |
|---|---|
| Alias (Confounding) | Gán nhầm (Confounding) |
| When two or more effects cannot be distinguished from each other in a fractional factorial design. Each effect is aliased with one or more other effects. | Khi hai hoặc nhiều hiệu ứng không thể phân biệt với nhau trong thiết kế giai thừa phân số. Mỗi hiệu ứng được gán nhầm với một hoặc nhiều hiệu ứng khác. |
📂 Design of Experiments (DOE)
| English | Tiếng Việt |
|---|---|
| Alignment (Strategy) | Căn chỉnh (Chiến lược) |
| Ensuring all parts of the organization work toward common strategic goals. | Đảm bảo tất cả bộ phận trong tổ chức làm việc hướng tới mục tiêu chiến lược chung. |
📂 BSC / KPI / OKR / Hoshin Kanri
| English | Tiếng Việt |
|---|---|
| Alignment | Siloed departments |
| Alignment | Siloed departments | Cross-functional, enterprise | Alignment | Siloed departments | Cross-functional, enterprise |
📂 ERP/Software
| English | Tiếng Việt |
|---|---|
| Alpha (α) | Alpha (α) |
| Used in hypothesis testing, alpha (α) is the maximum acceptable level of risk for rejecting a true null hypothesis (type I error) and is expressed as a probability ranging between 0 and 1. Alpha is frequently referred to as the level of significance. You should set α before beginning the analysis then compare p-values to α to determine significance: | Alpha (α) được sử dụng trong kiểm định giả thuyết, là mức độ rủi ro tối đa chấp nhận được để loại bỏ một giả thuyết không chính xác (lỗi loại I) và được biểu diễn dưới dạng xác suất từ 0 đến 1. Alpha thường được gọi là mức độ ý nghĩa. Bạn nên thiết lập α trước khi bắt đầu phân tích và sau đó so sánh giá trị p với α để xác định sự quan trọng: |
| · If your p-value is less than or equal to the α-level, reject the null hypothesis in favor of the alternative hypothesis. | · Nếu giá trị p của bạn nhỏ hơn hoặc bằng α, loại bỏ giả thuyết không chính xác và chọn giả thuyết thay thế. |
| · If your p-value is greater than the α-level, fail to reject the null hypothesis. | · Nếu giá trị p của bạn lớn hơn α, không loại bỏ giả thuyết không chính xác. |
| The most commonly used α-level is 0.05. At this level, your chance of finding an effect that does not really exist is only 5%. The smaller the α value, the less likely you are to incorrectly reject the null hypothesis. However, a smaller value for α also means a decreased chance of detecting an effect if one truly exists (lower power). | Mức α thường được sử dụng nhất là 0.05. Ở mức này, cơ hội của bạn để phát hiện ra một hiệu ứng không thực sự tồn tại chỉ là 5%. Giá trị α càng nhỏ, khả năng loại bỏ sai giả thuyết không chính xác càng ít. Tuy nhiên, một giá trị α nhỏ cũng có nghĩa là giảm khả năng phát hiện hiệu ứng nếu thực sự có một hiệu ứng (sức mạnh thấp). |
| Sometimes it may be better to choose a smaller value for α. For example, you are testing samples from a new milling machine to decide whether to purchase a dozen for your plant. You stand to save a large amount of money due to fewer defective products if the new machine is more accurate. However, the cost of purchasing and installing a dozen machines is very high. You want to be sure that the new machine is more accurate before making the purchase. In this case, you might want to select a lower value for α, such as 0.001. That way, you have only a 0.1% chance of concluding the new machine is more accurate, if in fact no difference exists. | Đôi khi việc chọn một giá trị α nhỏ hơn có thể tốt hơn. Ví dụ, bạn đang kiểm tra các mẫu từ một máy tiện mới để quyết định có nên mua một tá cho nhà máy của bạn hay không. Nếu máy mới chính xác hơn, bạn có thể tiết kiệm một lượng lớn tiền do sản phẩm lỗi ít hơn. Tuy nhiên, chi phí mua và lắp đặt một tá máy rất cao. Bạn muốn chắc chắn rằng máy mới chính xác hơn trước khi mua. Trong trường hợp này, bạn có thể muốn chọn một giá trị α thấp hơn, chẳng hạn như 0.001. Điều này có nghĩa là bạn chỉ có 0.1% cơ hội kết luận rằng máy mới chính xác hơn, nếu thực tế không có sự khác biệt. |
| On the other hand, sometimes choosing a larger value for α is better. For example, suppose you are a jet engine manufacturer and you are testing the strength of cheaper ball bearings. Saving a small amount of money does not outweigh the potentially disastrous effects if the bearings are weaker. Therefore, you might want to select a higher value for α, such as 0.1. Although this means you will be more likely to reject a true null hypothesis, more importantly, you will also be more likely to detect a real weakness in the cheaper bearings. | Ngược lại, đôi khi việc chọn một giá trị α lớn hơn có thể tốt hơn. Ví dụ, giả sử bạn là nhà sản xuất động cơ phản lực và bạn đang kiểm tra sức mạnh của bạc đạn rẻ tiền hơn. Tiết kiệm một số tiền nhỏ không là gì so với các hiệu ứng tiềm ẩn nếu bạc đạn yếu hơn. Do đó, bạn có thể muốn chọn một giá trị α cao hơn, chẳng hạn như 0.1. Mặc dù điều này có nghĩa là bạn sẽ có khả năng loại bỏ một giả thuyết không chính xác thực sự, quan trọng hơn, bạn cũng có khả năng phát hiện ra một điểm yếu thực sự trong các bạc đạn rẻ tiền hơn. |
Xem thêm: Tài liệu tham khảo liên quan
| English | Tiếng Việt |
|---|---|
| Alpha for Axial Points | Alpha cho các điểm trục |
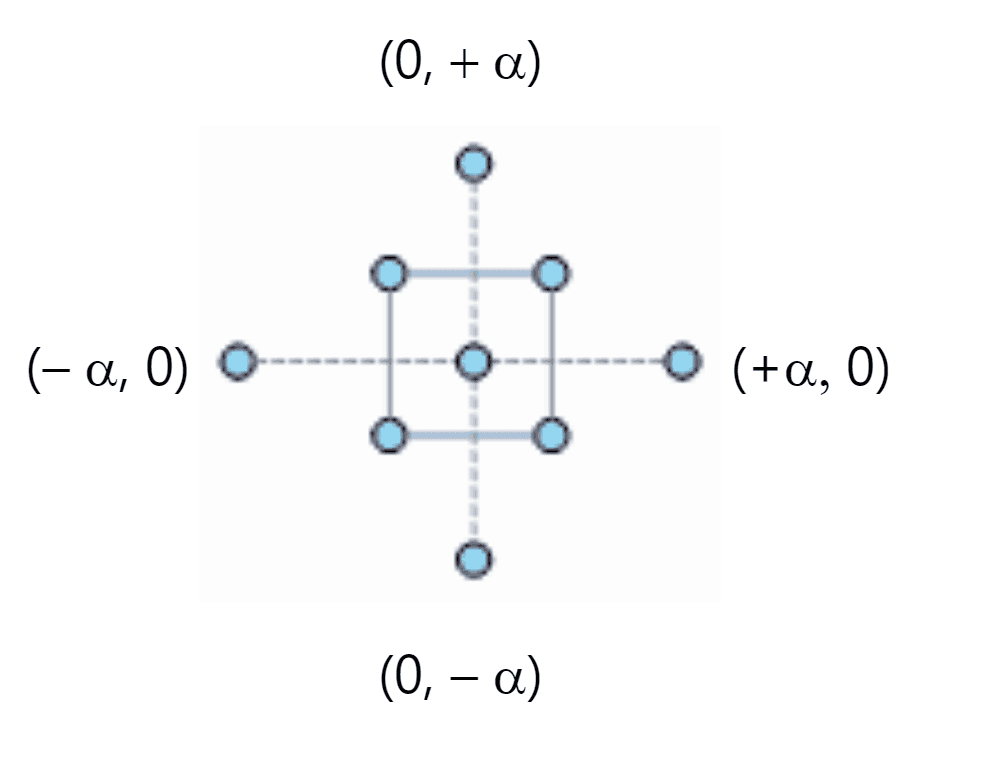
| The distance of each axial point (also called star point) from the center in a central composite design. This value (α), along with the number of center points, determines whether a design can be orthogonally blocked and is rotatable. | Khoảng cách của mỗi điểm trục (còn được gọi là điểm sao) từ trung tâm trong một thiết kế hỗn hợp trung tâm. Giá trị này (α), cùng với số lượng điểm trung tâm, quyết định liệu một thiết kế có thể được chặn vuông góc và có thể quay hay không. |
| English | Tiếng Việt |
|---|---|
| Alternative Hypothesis (Ha or H1) | Giả thuyết Thay thế (Ha hoặc H1) |
| A statement that there is an effect or difference. It is what the researcher is trying to prove. | Phát biểu có hiệu ứng hoặc sự khác biệt. Đây là điều nhà nghiên cứu đang cố gắng chứng minh. |
📂 Hypothesis Testing
| English | Tiếng Việt |
|---|---|
| Always ready | Cramming trước audit |
| Audit readiness | Cramming trước audit | Always ready | Audit readiness | Cramming trước audit | Always ready |
📂 Quality Management
| English | Tiếng Việt |
|---|---|
| Amazon | Recommendation Engine |
| Amazon — Recommendation Engine | Amazon — Recommendation Engine |
📂 General
| English | Tiếng Việt |
|---|---|
| Analysis of Covariance (ANCOVA) | Phân tích Hiệp dụng (ANCOVA) |
| ANCOVA is an extension of analysis of variance (ANOVA) that allows you to model and adjust for input variables that were measured but not randomized or controlled in the experiment. ANCOVA tests whether factors have an effect after removing the variance due to covariates. Common covariates include ambient temperature, humidity, and characteristics of a part or subject before a treatment is applied. | Mở rộng của phân tích phương sai (ANOVA) cho phép bạn mô hình và điều chỉnh cho các biến đầu vào đã được đo lường nhưng không được ngẫu nhiên hoặc kiểm soát trong thí nghiệm. ANCOVA kiểm tra xem các yếu tố có ảnh hưởng sau khi loại bỏ phương sai do các biến điều tiết. Các biến điều tiết phổ biến bao gồm nhiệt độ môi trường, độ ẩm và các đặc điểm của một phần hoặc đối tượng trước khi áp dụng một liệu pháp. |
| For example, an engineer wants to study the level of corrosion on four types of iron beams. He exposes each beam to a liquid treatment to accelerate corrosion, but he cannot control the temperature of the liquid. Temperature is a covariate that should be considered in the model. | Ví dụ, một kỹ sư muốn nghiên cứu mức độ ăn mòn trên bốn loại thanh sắt. Anh ấy ti exposed từng thanh sắt với một liệu pháp lỏng để tăng tốc quá trình ăn mòn, nhưng anh ấy không thể kiểm soát nhiệt độ của dung dịch. Nhiệt độ là một biến điều tiết cần phải được xem xét trong mô hình. |
| In Minitab, you can perform ANCOVA using Stat > ANOVA > General Linear Model > Fit General Linear Model. | Trong Minitab, bạn có thể thực hiện ANCOVA bằng cách vào Stat > ANOVA > General Linear Model > Fit General Linear Model. |
Xem thêm: Tài liệu tham khảo liên quan
| English | Tiếng Việt |
|---|---|
| Analysis of Means (ANOM) | Phân tích Các giá trị Trung bình (ANOM) |
| ANOM is a graphical analog to ANOVA that tests the equality of population means. The graph displays each factor level mean, the overall mean, and the decision limits. If a point falls outside the decision limits, then evidence exists that the factor level mean represented by that point is significantly different from the overall mean. | ANOM là một biểu đồ tương tự như ANOVA để kiểm tra sự bằng nhau của các giá trị trung bình của dân số. Biểu đồ hiển thị giá trị trung bình của từng cấp độ yếu tố, giá trị trung bình tổng thể và giới hạn quyết định. Nếu một điểm nằm ngoài giới hạn quyết định, có bằng chứng cho rằng giá trị trung bình của cấp độ yếu tố được biểu thị bởi điểm đó khác biệt đáng kể so với giá trị trung bình tổng thể. |
| For example, you are investigating how temperature and additive settings affect the rating of your product. After your experiment, you use ANOM to generate the following graph. | Ví dụ, bạn đang nghiên cứu cách mà nhiệt độ và cài đặt chất phụ gia ảnh hưởng đến xếp hạng của sản phẩm của bạn. Sau khi thí nghiệm, bạn sử dụng ANOM để tạo biểu đồ sau. |
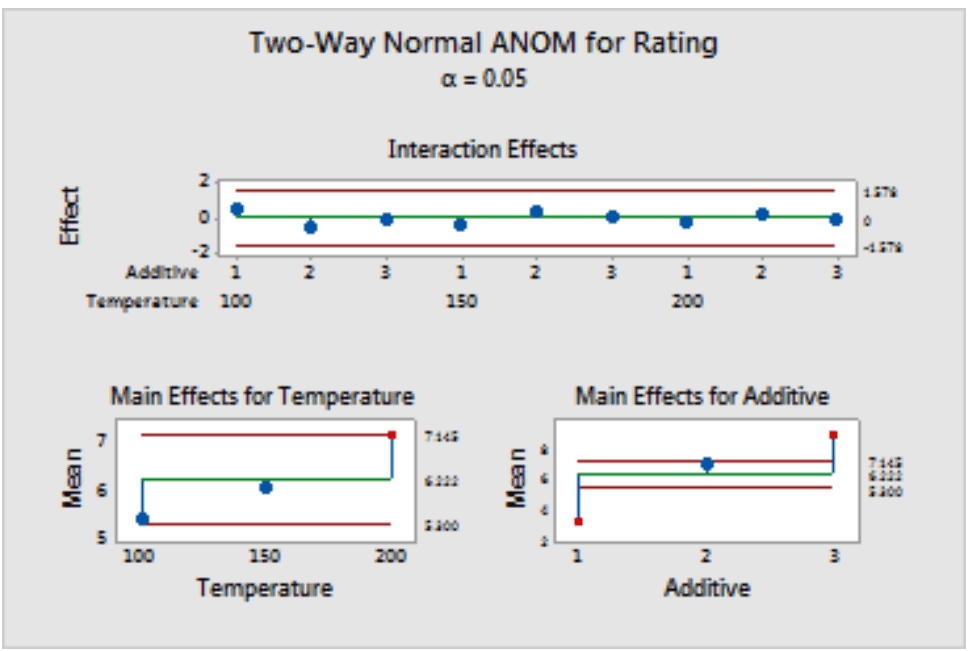
| In this example, the top plot shows that the interaction effects are well within the decision limits, signifying no evidence of interaction. The lower two plots show the means for the levels of the two factors, with the main effect being the difference between the mean and the center line. In the lower left plot, the point representing the third mean of the factor Temperature is displayed by a red symbol, indicating that there is evidence that the Temperature 200 mean is significantly different from the overall mean at a = 0.05. The main effects for levels 1 and 3 of the Additive factor are well outside the decision limits of the lower right plot, signifying that there is evidence that these means are different from the overall mean. | Trong ví dụ này, biểu đồ trên cùng cho thấy rằng các tác động tương tác nằm trong giới hạn quyết định, cho thấy không có bằng chứng về tương tác. Hai biểu đồ dưới hiển thị các giá trị trung bình cho các cấp độ của hai yếu tố, với hiệu ứng chính là sự khác biệt giữa giá trị trung bình và đường trung tâm. Trong biểu đồ dưới bên trái, điểm biểu thị giá trị trung bình thứ ba của yếu tố Nhiệt độ được hiển thị bằng một ký hiệu màu đỏ, cho thấy có bằng chứng cho rằng giá trị trung bình Nhiệt độ 200 khác biệt đáng kể so với giá trị trung bình tổng thể tại a = 0.05. Hiệu ứng chính cho các cấp độ 1 và 3 của yếu tố Phụ gia nằm ngoài giới hạn quyết định của biểu đồ dưới bên phải, cho thấy có bằng chứng cho rằng các giá trị trung bình này khác biệt so với giá trị trung bình tổng thể. |
| ANOM can be used with normal response distributions, as with ANOVA, but you can also use ANOM with binomial or Poisson distributions. The null hypotheses for ANOM and ANOVA are the same: all factor level means are equal. However, the alternative hypotheses are subtly different. | ANOM có thể được sử dụng với phân phối phản ứng bình thường, như ANOVA, nhưng bạn cũng có thể sử dụng ANOM với các phân phối nhị phân hoặc Poisson. Các giả thuyết không có của ANOM và ANOVA là giống nhau: tất cả các giá trị trung bình cấp độ yếu tố bằng nhau. Tuy nhiên, các giả thuyết thay thế khác nhau một cách tinh subtile. |
| If one group of factor level means is above the overall mean and another group of means is below the overall mean, the F-test for ANOVA might indicate evidence for differences where ANOM might not. | Nếu một nhóm giá trị trung bình cấp độ yếu tố nằm trên giá trị trung bình tổng thể và một nhóm giá trị khác nằm dưới giá trị trung bình tổng thể, thì kiểm định F cho ANOVA có thể chỉ ra có bằng chứng cho sự khác biệt trong khi ANOM không thể. |
| If the mean of one factor level is separated from the other means, the ANOVA F-test might not indicate evidence for differences whereas ANOM might flag this group as being different from the overall mean. | Nếu giá trị trung bình của một cấp độ yếu tố được tách biệt khỏi các giá trị trung bình khác, thì kiểm định F của ANOVA có thể không chỉ ra có bằng chứng cho sự khác biệt trong khi ANOM có thể xác định nhóm này khác biệt so với giá trị trung bình tổng thể. |
| English | Tiếng Việt |
|---|---|
| Analysis of Variance (ANOVA) | Phân tích Phương sai (ANOVA) |
| Tests the hypothesis that the means of two or more populations are equal. ANOVAs evaluate the importance of one or more factors by comparing the response variable means at the different factor levels. The null hypothesis states that all population means (factor level means) are equal while the alternative hypothesis states that at least one is different. | Kiểm định giả thuyết rằng giá trị trung bình của hai hoặc nhiều quần thể là bằng nhau. ANOVA đánh giá sự quan trọng của một hoặc nhiều yếu tố bằng cách so sánh giá trị trung bình biến phản ứng ở các cấp độ yếu tố khác nhau. Giả thuyết không có (null hypothesis) khẳng định rằng tất cả các giá trị trung bình của quần thể (giá trị trung bình cấp độ) là bằng nhau trong khi giả thuyết thay thế cho rằng ít nhất một giá trị trung bình khác biệt. |
| To run an ANOVA, you must have a continuous response variable and at least one categorical factor with two or more levels. ANOVAs require data from normally distributed populations with roughly equal variances between factor levels. | Để thực hiện ANOVA, bạn phải có một biến phản ứng liên tục và ít nhất một yếu tố phân loại với hai hoặc nhiều cấp độ. ANOVA yêu cầu dữ liệu từ các quần thể phân phối theo phân phối chuẩn với phương sai gần bằng nhau giữa các cấp độ yếu tố. |
| For example, you design an experiment to assess the durability of four experimental carpet products. You place a sample of each carpet type in ten homes and you measure durability after 60 days. Because you are examining one factor (carpet type) you use a one-way ANOVA. | Ví dụ, bạn thiết kế một thí nghiệm để đánh giá độ bền của bốn sản phẩm thảm thí nghiệm. Bạn đặt một mẫu của mỗi loại thảm trong mười ngôi nhà và bạn đo độ bền sau 60 ngày. Vì bạn đang xem xét một yếu tố (loại thảm) nên bạn sử dụng một ANOVA một chiều. |
| If the p-value is less than your alpha, then you conclude that at least one durability mean is different. To further explore the differences between specific means, use a multiple comparison method such as Tukey’s. | Nếu giá trị p nhỏ hơn alpha của bạn, sau đó bạn kết luận rằng ít nhất một giá trị trung bình về độ bền là khác biệt. Để khám phá sâu hơn về sự khác biệt giữa các giá trị trung bình cụ thể, hãy sử dụng một phương pháp so sánh đa nhóm như phương pháp của Tukey. |
| The name “analysis of variance” is based on the manner in which the procedure uses variances to determine whether the means are different. The procedure works by comparing the variance between group means versus the variance within groups as a method of determining whether the groups are all part of one larger population or separate populations with different characteristics. | Tên “phân tích phương sai” được dựa trên cách thức thủ tục sử dụng phương sai để xác định xem các giá trị trung bình có khác nhau hay không. Thủ tục hoạt động bằng cách so sánh phương sai giữa giá trị trung bình của nhóm so với phương sai trong các nhóm như một phương pháp xác định xem các nhóm có phải là một phần của một quần thể lớn hơn hay là các quần thể riêng biệt với các đặc điểm khác nhau. |
| Minitab has different types of ANOVAs to allow for additional factors, types of factors, and different designs to suit your specific needs. | Minitab có các loại ANOVA khác nhau để cho phép yếu tố bổ sung, các loại yếu tố và các thiết kế khác nhau để phù hợp với nhu cầu cụ thể của bạn. |
Xem thêm: Tài liệu tham khảo liên quan
| English | Tiếng Việt |
|---|---|
| Analysis of Variance (ANOVA) Table | Bảng Phân tích Phương sai (ANOVA) |
| The main output from an analysis of variance study arranged in a table. Lists the sources of variation, their degrees of freedom, the total sum of squares, and the mean squares. The analysis of variance table also includes the F-statistics and p-values. Use these to determine whether the predictors or factors are significantly related to the response. | Đầu ra chính từ một nghiên cứu phân tích phương sai được sắp xếp trong một bảng. Liệt kê các nguồn biến thiên, bậc tự do của chúng, tổng tổng bình phương, và tổng bình phương trung bình. Bảng phân tích phương sai cũng bao gồm các thống kê F và giá trị p. Sử dụng chúng để xác định liệu các yếu tố hoặc dự đoán có mối quan hệ có ý nghĩa với biến phản ứng hay không. |
| Here are the components of an ANOVA table: | Dưới đây là các thành phần của bảng ANOVA: |
| – Source: indicates the source of variation, either from the factor, the interaction, or the error. The total is a sum of all the sources. | – Nguồn: chỉ ra nguồn biến thiên, có thể từ yếu tố, sự tương tác, hoặc lỗi. Tổng cộng là tổng của tất cả các nguồn. |
| – DF (degrees of freedom): degrees of freedom from each source. If a factor has three levels, the degrees of freedom is 2 (n-1). If you have a total of 30 observations, the degrees of freedom total is 29 (n – 1). | – DF (bậc tự do): bậc tự do từ mỗi nguồn. Nếu một yếu tố có ba cấp độ, thì bậc tự do là 2 (n-1). Nếu bạn có tổng cộng 30 quan sát, bậc tự do tổng cộng là 29 (n – 1). |
| – SS (sum of squares): sum of squares between groups (factor) and the sum of squares within groups (error). | – SS (tổng bình phương): tổng bình phương giữa các nhóm (yếu tố) và tổng bình phương trong các nhóm (lỗi). |
| – MS (mean squares): found by dividing the sum of squares by the degrees of freedom. | – MS (tổng bình phương trung bình): được tính bằng cách chia tổng bình phương cho bậc tự do. |
| – F (F-statistic): calculated by dividing the factor MS by the error MS. Compare this ratio against a critical F or use the p-value to determine significance. | – F (Thống kê F): tính bằng cách chia MS của yếu tố cho MS của lỗi. So sánh tỷ lệ này với F quan trọng hoặc sử dụng giá trị p để xác định ý nghĩa. |
| – P (p-value): use to determine whether a factor is significant; typically compare against an alpha value of 0.05. If the p-value is lower than 0.05, then the factor is significant. | – P (giá trị p): sử dụng để xác định xem một yếu tố có ý nghĩa không; thường so sánh với giá trị alpha là 0.05. Nếu giá trị p nhỏ hơn 0.05, thì yếu tố đó là ý nghĩa. |
| One-way ANOVA table | Bảng ANOVA một chiều |
| Example: Suppose you run an ANOVA to determine which of three different colored flyers produced the most sales. You set up the ANOVA so that your factor is “flyer color” which has the three levels of “black and white”, “red” and “yellow.” Your response variable is weekly sales during the test period, 10 weeks. Since you are examining one factor you use a one-way ANOVA. | Ví dụ: Giả sử bạn thực hiện một ANOVA để xác định loại tờ rơi nào trong ba tờ rơi khác nhau tạo ra doanh số bán hàng cao nhất. Bạn thiết lập ANOVA để yếu tố của bạn là “màu tờ rơi” có ba cấp độ là “đen trắng”, “đỏ” và “vàng”. Biến phản ứng của bạn là doanh số bán hàng hàng tuần trong thời gian thử nghiệm, 10 tuần. Vì bạn đang xem xét một yếu tố nên bạn sử dụng ANOVA một chiều. |
| Source | Nguồn |
| Factor | Yếu tố |
| Error | Lỗi |
| DF | Bậc tự do |
| SS | Tổng bình phương |
| MS | Tổng bình phương trung bình |
| F | Thống kê F |
| P | Giá trị p |
| The p-value of 0.000 indicates that the factor of color is significant. For a two-way ANOVA, you will have two factors and an interaction term. For DOE and regression applications, you can have several factors, or sources of variation. | Giá trị p là 0.000 cho thấy rằng yếu tố màu sắc là có ý nghĩa. Đối với ANOVA hai chiều, bạn sẽ có hai yếu tố và một thuật ngữ tương tác. Đối với ứng dụng DOE và hồi quy, bạn có thể có một số yếu tố hoặc nguồn biến thiên. |

| English | Tiếng Việt |
|---|---|
| Analyst | CI Engineers, Green Belts |
| Analyst | CI Engineers, Green Belts | 2 days | Quantification, root cause, project charter, ROI calc | Analyst | CI Engineers, Green Belts | 2 days | Quantification, root cause, project charter, ROI calc |
📂 Six Sigma
| English | Tiếng Việt |
|---|---|
| Analytics | Cơ bản |
| Analytics | Không | Cơ bản | AI-powered | Analytics | Không | Cơ bản | AI-powered |
📂 AI/Digital
| English | Tiếng Việt |
|---|---|
| Analyze Phase | Giai đoạn Phân tích |
| The third phase of DMAIC where data is analyzed to identify root causes of defects and variation. Uses statistical tools like hypothesis testing and regression analysis. | Giai đoạn thứ ba của DMAIC trong đó dữ liệu được phân tích để xác định nguyên nhân gốc của khuyết tật và biến thiên. Sử dụng các công cụ thống kê như kiểm tra giả thuyết và phân tích hồi quy. |
📂 Six Sigma DMAIC
| English | Tiếng Việt |
|---|---|
| Analyze | Root |
| Analyze — Root cause, hypothesis testing, stratification | Analyze — Root cause, hypothesis testing, stratification |
📂 General
| English | Tiếng Việt |
|---|---|
| Analyze Variability (DOE) | Phân tích Biến thiên (DOE) |
| Identifies factor settings that produce less variable results in 2-level factorial designs with repeat or replicate measurements. Minitab calculates and stores the standard deviations of your responses and analyzes them to detect differences, or dispersion effects, across factor settings. | Xác định cài đặt yếu tố tạo ra kết quả ít biến thiên hơn trong các thiết kế mức độ yếu tố 2 cấp với các đo lặp lại hoặc nhân bản. Minitab tính toán và lưu trữ độ lệch chuẩn của phản ứng của bạn và phân tích chúng để phát hiện sự khác biệt hoặc hiệu ứng phân tán, qua các cài đặt yếu tố. |
| For example, a publishing company wants to find the printing press (1, 2, or 3) and line speed (A, B, C, D) that results in the highest print quality. Using Analyze Variability, they find that one setting combination (press 1 and line speed B) results in excessive variation to the point that a large number of pages are unreadable. When analyzing the means using Analyze Factorial Design, they can find the settings that produce both the best average and most consistent response. | Ví dụ, một công ty xuất bản muốn tìm máy in (1, 2 hoặc 3) và tốc độ dây chuyền (A, B, C, D) tạo ra chất lượng in cao nhất. Sử dụng Phân tích Biến thiên, họ nhận thấy rằng một sự kết hợp cài đặt (máy in 1 và tốc độ dây chuyền B) dẫn đến biến thiên quá mức đến mức một số trang rất nhiều không đọc được. Khi phân tích trung bình sử dụng Phân tích Thiết kế Factorial, họ có thể tìm ra cài đặt tạo ra cả trung bình tốt nhất và phản ứng đồng nhất nhất. |
| You can use the results of Analyze Variability as weights when you analyze the mean responses in Analyze Factorial Design. If the variances are not constant, observations with large variances are given relatively small weight and observations with small variances are given relatively large weight. | Bạn có thể sử dụng kết quả của Phân tích Biến thiên làm trọng số khi bạn phân tích trung bình các phản ứng trong Phân tích Thiết kế Factorial. Nếu phương sai không đều, các quan sát với phương sai lớn được gán trọng số tương đối nhỏ và các quan sát với phương sai nhỏ được gán trọng số tương đối lớn. |
Xem thêm: Tài liệu tham khảo liên quan
| English | Tiếng Việt |
|---|---|
| Anderson-Darling statistic | Thống kê Anderson-Darling |
| Measures how well the data follow a particular distribution. The better the distribution fits the data, the smaller this statistic will be. Use the Anderson-Darling statistic to compare the fit of several distributions to see which one is best or to test whether a sample of data comes from a population with a specified distribution. For example, you can use the Anderson-Darling statistic to choose between the Weibull and lognormal distributions for a reliability data analysis or to test whether data meets the assumption of normality for a t-test. | Đo lường mức độ dữ liệu tuân theo một phân phối cụ thể. Càng tốt phân phối phù hợp với dữ liệu, thống kê này sẽ càng nhỏ. Sử dụng thống kê Anderson-Darling để so sánh sự phù hợp của một số phân phối để xem xét phân phối nào tốt nhất hoặc để kiểm tra liệu một mẫu dữ liệu có đến từ một quần thể có phân phối cụ thể hay không. Ví dụ, bạn có thể sử dụng thống kê Anderson-Darling để lựa chọn giữa phân phối Weibull và lognormal cho phân tích dữ liệu độ tin cậy hoặc để kiểm tra liệu dữ liệu đáp ứng điều kiện chuẩn của phân phối chuẩn cho một kiểm định t-test. |
| The hypotheses for the Anderson-Darling test are: | Các giả thuyết cho kiểm định Anderson-Darling là: |
| H0: The data follow a specified distribution | H0: Dữ liệu tuân theo một phân phối được chỉ định |
| H1: The data do not follow a specified distribution | H1: Dữ liệu không tuân theo một phân phối được chỉ định |
| If the p-value (when available) for the Anderson-Darling test is lower than the chosen significance level (usually 0.05 or 0.10), conclude that the data do not follow the specified distribution. Minitab does not always display a p-value for the Anderson-Darling test because it does not mathematically exist for certain cases. | Nếu giá trị p (khi có sẵn) cho kiểm định Anderson-Darling thấp hơn ngưỡng ý nghĩa được chọn (thường là 0.05 hoặc 0.10), kết luận rằng dữ liệu không tuân theo phân phối được chỉ định. Minitab không luôn hiển thị giá trị p cho kiểm định Anderson-Darling vì nó không tồn tại toán học cho một số trường hợp. |
| If you are trying to determine which distribution the data follow and you have multiple Anderson-Darling statistics, it is generally correct to compare them. The distribution with the smallest Anderson-Darling statistic has the closest fit to the data. If distributions have similar Anderson-Darling statistics, choose one based on practical knowledge. | Nếu bạn đang cố gắng xác định phân phối nào mà dữ liệu tuân theo và bạn có nhiều thống kê Anderson-Darling, thì nó thường đúng để so sánh chúng. Phân phối có thống kê Anderson-Darling nhỏ nhất sẽ phù hợp nhất với dữ liệu. Nếu các phân phối có thống kê Anderson-Darling tương tự, hãy chọn một dựa trên kiến thức thực tế. |
| Some commands generate an adjusted Anderson-Darling, or AD*, statistic. The non-adjusted Anderson-Darling statistic uses the nonparametric step function based on the Kaplan-Meier method of calculating plot points, while the adjusted Anderson-Darling statistic uses other methods to calculate the plot points. | Một số lệnh tạo ra một thống kê Anderson-Darling điều chỉnh, hoặc AD*. Thống kê Anderson-Darling không điều chỉnh sử dụng hàm bước phi tham số dựa trên phương pháp Kaplan-Meier để tính các điểm đồ thị, trong khi thống kê Anderson-Darling điều chỉnh sử dụng các phương pháp khác để tính các điểm đồ thị. |
Xem thêm: Tài liệu tham khảo liên quan
| English | Tiếng Việt |
|---|---|
| Andon | Call for help (shame) |
| Andon | Call for help (shame) | Call for support (learning) | Andon | Call for help (shame) | Call for support (learning) |
📂 Lean
| English | Tiếng Việt |
|---|---|
| Annual Objectives | Mục tiêu hàng năm |
| Specific measurable objectives derived from breakthrough objectives, to be achieved within a year. | Các mục tiêu cụ thể bắt nguồn từ mục tiêu đột phá, sẽ được đạt được trong vòng một năm. |
📂 BSC / KPI / OKR / Hoshin Kanri
| English | Tiếng Việt |
|---|---|
| Annual review | Yearly |
| Annual review | Yearly | Quality manager | Annual review | Yearly | Quality manager |
📂 Quality Management
| English | Tiếng Việt |
|---|---|
| Annual ROI | 300-500% |
| Annual ROI | 300-500% | 500-1000% | Annual ROI | 300-500% | 500-1000% |
📂 General
| English | Tiếng Việt |
|---|---|
| Annual survey length | Indifferent |
| Annual survey length | Indifferent | Shorten or remove | Annual survey length | Indifferent | Shorten or remove |
📂 General
| English | Tiếng Việt |
|---|---|
| Anomaly Detection | Phát hiện Bất thường |
| AI techniques identifying unusual patterns that deviate from expected behavior in data. | Kỹ thuật AI xác định các mẫu bất thường lệch khỏi hành vi dự kiến trong dữ liệu. |
📂 AI / Machine Learning in Manufacturing
| English | Tiếng Việt |
|---|---|
| ANOVA (Analysis of Variance) | Phân tích Phương sai (ANOVA) |
| A statistical test used to compare the means of three or more groups to determine if at least one group mean is significantly different from the others. | Kiểm định thống kê dùng để so sánh trung bình của ba nhóm trở lên nhằm xác định liệu ít nhất một trung bình nhóm có khác biệt đáng kể so với các nhóm khác. |
📂 Hypothesis Testing
| English | Tiếng Việt |
|---|---|
| ANOVA | Statistical significance |
| ANOVA | Statistical significance | Continuous, categorical factors | P-values, significant factors | ANOVA | Statistical significance | Continuous, categorical factors | P-values, significant factors |
📂 General
| English | Tiếng Việt |
|---|---|
| API Economy | Kinh tế API |
| The set of business models enabled by connecting applications and data through APIs. | Bộ mô hình kinh doanh được kích hoạt bằng cách kết nối ứng dụng và dữ liệu qua API. |
📂 Digital Transformation / Industry 4.0
| English | Tiếng Việt |
|---|---|
| API error rate | 12% |
| API error rate | 12% | 0.5% | -96% | API error rate | 12% | 0.5% | -96% |
📂 ERP/Software
| English | Tiếng Việt |
|---|---|
| API response time | 2.5 giây |
| API response time | 2.5 giây | 120ms | -95% | API response time | 2.5 giây | 120ms | -95% |
📂 ERP/Software
| English | Tiếng Việt |
|---|---|
| APIS (iQ-RM) | Enterprise FMEA platform |
| APIS (iQ-RM) | Enterprise FMEA platform | Full AIAG VDA | APIS (iQ-RM) | Enterprise FMEA platform | Full AIAG VDA |
📂 Six Sigma
| English | Tiếng Việt |
|---|---|
| App Store rating | 3.2 sao |
| App Store rating | 3.2 sao | 4.7 sao | +47% | App Store rating | 3.2 sao | 4.7 sao | +47% |
📂 Six Sigma
| English | Tiếng Việt |
|---|---|
| Application | Maintenance scheduling, warranty planning |
| Application | Maintenance scheduling, warranty planning | Design validation, process risk assessment | Application | Maintenance scheduling, warranty planning | Design validation, process risk assessment |
📂 Six Sigma
| English | Tiếng Việt |
|---|---|
| Appraisal Cost | Chi phí đánh giá |
| Costs of measuring and monitoring quality: inspection, testing, audits. | Chi phí đo lường và giám sát chất lượng: kiểm tra, thử nghiệm, đánh giá. |
📂 Cost of Quality / COPQ
| English | Tiếng Việt |
|---|---|
| Appraisal | Customer |
| Appraisal: Customer feedback, mystery shopper = 3% of revenue | Appraisal: Customer feedback, mystery shopper = 3% of revenue |
📂 Six Sigma
| English | Tiếng Việt |
|---|---|
| Appraiser Variation | Biến thiên Người đánh giá |
| The variation in measurements due to differences between individuals conducting the measurements. A component of reproducibility. | Biến thiên trong các phép đo do sự khác biệt giữa các cá nhân thực hiện phép đo. Một thành phần của khả năng tái lập. |
📂 Measurement System Analysis (MSA)
| English | Tiếng Việt |
|---|---|
| Approach | Random, reactive |
| Approach | Random, reactive | Structured, systematic | Approach | Random, reactive | Structured, systematic |
📂 Six Sigma
| English | Tiếng Việt |
|---|---|
| Approval flow | Auto-routing, 2-3 steps |
| Approval flow | Auto-routing, 2-3 steps | Manual, 5-7 steps | Approval flow | Auto-routing, 2-3 steps | Manual, 5-7 steps |
📂 Six Sigma
| English | Tiếng Việt |
|---|---|
| Approval wait | NVA |
| Approval wait | NVA | Email chain 3 days for $50 PO | Approval wait | NVA | Email chain 3 days for $50 PO |
📂 Six Sigma
| English | Tiếng Việt |
|---|---|
| APQP | Quality planning framework |
| APQP | Quality planning framework | Product lifecycle | APQP | Quality planning framework | Product lifecycle |
📂 Six Sigma
| English | Tiếng Việt |
|---|---|
| Arccosine | Arccosine |
| Determines the angle corresponding to a given cosine. Arccosine is defined in radians from 0 to π. For example, the arccosine of 0.5 is π/6 or 0.5230 radians. | Xác định góc tương ứng với một cosin đã cho. Arccosine được xác định trong radians từ 0 đến π. Ví dụ, arccosine của 0.5 là π/6 hoặc 0.5230 radian. |
| Trigonometric functions are used to model periodic phenomena, such as cyclical seasonal patterns, and wave motion. They form the foundation for advanced analyses in electrical engineering, digital image processing, radiography, thermodynamics, telecommunications, and many other fields in science and technology. | Các hàm lượng giác được sử dụng để mô hình hóa hiện tượng chu kỳ, như các mô hình mùa vụ chu kỳ và chuyển động sóng. Chúng tạo nên nền tảng cho các phân tích tiên tiến trong kỹ thuật điện, xử lý hình ảnh kỹ thuật số, chụp X-quang, nhiệt động học, viễn thông và nhiều lĩnh vực khác trong khoa học và công nghệ. |
| In Minitab, you can use the Calculator to find the arccosine of a number or a column of data. | Trong Minitab, bạn có thể sử dụng máy tính để tìm arccosine của một số hoặc một cột dữ liệu. |
| Arccosine is also called the inverse cosine and can be represented by cos⁻¹ x, arccos x, or acos x. | Arccosine còn được gọi là cosine nghịch đảo và có thể được biểu diễn bằng cos⁻¹ x, arccos x, hoặc acos x. |
Xem thêm: Tài liệu tham khảo liên quan
| English | Tiếng Việt |
|---|---|
| Arrow Diagram | Biểu đồ mũi tên |
| Illustrating sequential steps and interdependencies of a project or process. | Minh họa các bước tuần tự và sự phụ thuộc lẫn nhau của một dự án hoặc quá trình. |
📂 New 7 Management Tools
| English | Tiếng Việt |
|---|---|
| Arrow | Flow |
| Arrow | Flow | Sequence direction | Step 1 -> Step 2 | Arrow | Flow | Sequence direction | Step 1 -> Step 2 |
📂 General
| English | Tiếng Việt |
|---|---|
| ASQ | Global gold standard |
| ASQ | Global gold standard | USD 300-500 | Computer-based testing | International career, US companies | ASQ | Global gold standard | USD 300-500 | Computer-based testing | International career, US companies |
📂 General
| English | Tiếng Việt |
|---|---|
| Assembly | Is assembly vertical (top-down)? |
| Assembly | Is assembly vertical (top-down)? | Redesign for vertical assembly | Assembly | Is assembly vertical (top-down)? | Redesign for vertical assembly |
📂 General
| English | Tiếng Việt |
|---|---|
| Assessment App | Audit |
| Assessment App — Audit 5S TPM TQM IATF Checklist Mobile | Assessment App — Audit 5S TPM TQM IATF Checklist Mobile |
📂 Lean
| English | Tiếng Việt |
|---|---|
| Assessment Results | Kết |
| Assessment Results — Kết quả đánh giá | Assessment Results — Kết quả đánh giá |
📂 General
| English | Tiếng Việt |
|---|---|
| Assessment | Subjective scoring |
| Assessment | Subjective scoring | Standardized matrix | Assessment | Subjective scoring | Standardized matrix |
📂 General
| English | Tiếng Việt |
|---|---|
| Asset tracking | 60% |
| Asset tracking | 60% | 100% | +40% | Asset tracking | 60% | 100% | +40% |
📂 General
| English | Tiếng Việt |
|---|---|
| Attractive | Innovation budget |
| Attractive | Innovation budget | Semi-annual | Delight score, NPS lift | Attractive | Innovation budget | Semi-annual | Delight score, NPS lift |
📂 General
| English | Tiếng Việt |
|---|---|
| Attribute (defectives) | Variable |
| Attribute (defectives) | Variable | np-chart | Number defective | Attribute (defectives) | Variable | np-chart | Number defective |
📂 General
| English | Tiếng Việt |
|---|---|
| Attribute (defects) | Variable |
| Attribute (defects) | Variable | u-chart | Defects per unit (variable area) | Attribute (defects) | Variable | u-chart | Defects per unit (variable area) |
📂 General
| English | Tiếng Việt |
|---|---|
| Attribute (pass/fail) | Defect concentration chart by location/time |
| Attribute (pass/fail) | Defect concentration chart by location/time | Scratch location on panel | Attribute (pass/fail) | Defect concentration chart by location/time | Scratch location on panel |
📂 AI/Digital
| English | Tiếng Việt |
|---|---|
| Attribute Data | Dữ liệu Thuộc tính |
| Discrete, countable data that can be classified into categories (pass/fail, good/bad, yes/no). Examples: defect counts, conforming/nonconforming counts. | Dữ liệu rời rạc, có thể đếm được phân loại thành các danh mục (đạt/không đạt, tốt/xấu, có/không). Ví dụ: đếm khuyết tật, đếm phù hợp/không phù hợp. |
📂 Statistical Process Control (SPC)
| English | Tiếng Việt |
|---|---|
| Attribute Gage R&R | Gage R&R Thuộc tính |
| A study for attribute (pass/fail) measurement systems. Evaluates agreement within and between appraisers and against a known master value. | Nghiên cứu cho hệ thống đo lường thuộc tính (đạt/không đạt). Đánh giá sự đồng thuận trong và giữa những người đánh giá và so với giá trị chuẩn đã biết. |
📂 Measurement System Analysis (MSA)
| English | Tiếng Việt |
|---|---|
| Audience | Quality team, engineers |
| Audience | Quality team, engineers | Operators | Audience | Quality team, engineers | Operators |
📂 Quality Management
| English | Tiếng Việt |
|---|---|
| Audit (ISO) | Đánh giá (ISO) |
| Systematic, independent, and documented process for obtaining audit evidence and evaluating it objectively. | Quá trình có hệ thống, độc lập và được lập thành văn bản để thu thập bằng chứng đánh giá và đánh giá một cách khách quan. |
📂 ISO Standards
| English | Tiếng Việt |
|---|---|
| Audit (system/process/product) | Verify ongoing compliance |
| Audit (system/process/product) | Verify ongoing compliance | Annual / as needed | Audit (system/process/product) | Verify ongoing compliance | Annual / as needed |
📂 Quality Management
| English | Tiếng Việt |
|---|---|
| Audit | 1 đợt, 1 tuần |
| Audit | 3 đợt, 3 tuần | 1 đợt, 1 tuần | Audit | 3 đợt, 3 tuần | 1 đợt, 1 tuần |
📂 Quality Management
| English | Tiếng Việt |
|---|---|
| Audit chứng nhận | Chuẩn bị 4 tuần |
| Audit chứng nhận | Chuẩn bị 4 tuần | 1 tuần | Audit chứng nhận | Chuẩn bị 4 tuần | 1 tuần |
📂 Quality Management
| English | Tiếng Việt |
|---|---|
| Audit Criteria | Tiêu chí đánh giá |
| Policies, procedures, or requirements used as reference against which audit evidence is compared. | Chính sách, thủ tục hoặc yêu cầu được sử dụng làm tài liệu tham khảo để so sánh bằng chứng đánh giá. |
📂 ISO Standards
| English | Tiếng Việt |
|---|---|
| Audit Evidence | Bằng chứng đánh giá |
| Records, statements, or other information relevant to audit criteria and verifiable. | Hồ sơ, tuyên bố hoặc thông tin khác liên quan đến tiêu chí đánh giá và có thể kiểm chứng. |
📂 ISO Standards
| English | Tiếng Việt |
|---|---|
| Audit Findings | Kết quả đánh giá |
| Results of evaluation of collected audit evidence against audit criteria. | Kết quả đánh giá bằng chứng đánh giá đã thu thập so với tiêu chí đánh giá. |
📂 ISO Standards
| English | Tiếng Việt |
|---|---|
| Audit ISO 14001 | 3 ngày |
| Audit ISO 14001 | Chuẩn bị 3 tuần | 3 ngày | Audit ISO 14001 | Chuẩn bị 3 tuần | 3 ngày |
📂 Quality Management
| English | Tiếng Việt |
|---|---|
| Audit nội bộ | 2-3 tuần chuẩn bị |
| Audit nội bộ | 2-3 tuần chuẩn bị | 2-3 ngày | Audit nội bộ | 2-3 tuần chuẩn bị | 2-3 ngày |
📂 Quality Management
| English | Tiếng Việt |
|---|---|
| Audit prep | 4 ngày/site |
| Audit prep | 2 tuần/site | 4 ngày/site | Audit prep | 2 tuần/site | 4 ngày/site |
📂 Quality Management
| English | Tiếng Việt |
|---|---|
| Audit preparation | 2 tuần |
| Audit preparation | 12 tuần | 2 tuần | Audit preparation | 12 tuần | 2 tuần |
📂 Quality Management
| English | Tiếng Việt |
|---|---|
| Audit readiness | Manual compile |
| Audit readiness | Manual compile | Auto-report 1 click | Audit readiness | Manual compile | Auto-report 1 click |
📂 Quality Management
| English | Tiếng Việt |
|---|---|
| Auditor independence | Manual check |
| Auditor independence | Manual check | Auto-enforce | Auditor independence | Manual check | Auto-enforce |
📂 Quality Management
| English | Tiếng Việt |
|---|---|
| Augmented Reality (AR) | Thực tế Tăng cường (AR) |
| Technology that overlays digital information onto the real-world environment. | Công nghệ chồng thông tin số lên môi trường thực tế. |
📂 Digital Transformation / Industry 4.0
| English | Tiếng Việt |
|---|---|
| Auth | OAuth 2.0 + SAML + LDAP |
| Auth | OAuth 2.0 + SAML + LDAP | SSO enterprise, RBAC granular | Auth | OAuth 2.0 + SAML + LDAP | SSO enterprise, RBAC granular |
📂 ERP/Software
| English | Tiếng Việt |
|---|---|
| Auto (ANOVA vs Range) | Hand-pick (thường sai) |
| Method selection | Hand-pick (thường sai) | Auto (ANOVA vs Range) | Method selection | Hand-pick (thường sai) | Auto (ANOVA vs Range) |
📂 AI/Digital
| English | Tiếng Việt |
|---|---|
| Auto 50+ feature | Handpick (click từng feature) |
| Nhận diện feature | Handpick (click từng feature) | Auto 50+ feature | Nhận diện feature | Handpick (click từng feature) | Auto 50+ feature |
📂 General
| English | Tiếng Việt |
|---|---|
| Auto dashboard | Manual tính |
| Báo cáo carbon | Manual tính | Auto dashboard | Báo cáo carbon | Manual tính | Auto dashboard |
📂 General
| English | Tiếng Việt |
|---|---|
| Auto | Không |
| Phân tích nguyên nhân | Không | Auto | – | Phân tích nguyên nhân | Không | Auto | – |
📂 General
| English | Tiếng Việt |
|---|---|
| Auto real-time | Kiểm tra va đập |
| Kiểm tra va đập | Simulate manual | Auto real-time | Kiểm tra va đập | Simulate manual | Auto real-time |
📂 General
| English | Tiếng Việt |
|---|---|
| Auto reschedule | Xếp lại thủ công |
| Đơn hàng khẩn | Xếp lại thủ công | Auto reschedule | Đơn hàng khẩn | Xếp lại thủ công | Auto reschedule |
📂 General
| English | Tiếng Việt |
|---|---|
| Auto Time | Machine cycle time (sec) |
| Auto Time | Machine cycle time (sec) | 20, 30, 25 | Auto Time | Machine cycle time (sec) | 20, 30, 25 |
📂 General
| English | Tiếng Việt |
|---|---|
| Auto verification | Sensors confirm position |
| Auto verification | Sensors confirm position | Green light = ready | Auto verification | Sensors confirm position | Green light = ready |
📂 General
| English | Tiếng Việt |
|---|---|
| Auto-discovery, real-time | Excel, không đầy đủ |
| Asset inventory | Excel, không đầy đủ | Auto-discovery, real-time | Asset inventory | Excel, không đầy đủ | Auto-discovery, real-time |
📂 Supply Chain
| English | Tiếng Việt |
|---|---|
| Auto-generated | Tổng hợp thủ công |
| Báo cáo | Tổng hợp thủ công | Auto-generated | Báo cáo | Tổng hợp thủ công | Auto-generated |
📂 General
🎓 Học chuyên sâu hơn
Biết thuật ngữ chưa đủ — hãy học cách áp dụng thực tế