Từ Điển Lean Six Sigma
100 thuật ngữ chuyên ngành Lean Six Sigma, TPM, TQM, 5S/6S Kaizen
% (4)
| English | Tiếng Việt |
|---|---|
| %GR&R | < 10% |
| %GR&R | 30% | %GR&R | 30% |
📂 General
| English | Tiếng Việt |
|---|---|
| %GRR > 30% & %AV cao | Người đo |
| %GRR > 30% & %AV cao | Người đo | Đào tạo, chuẩn hóa SOP | %GRR > 30% & %AV cao | Người đo | Đào tạo, chuẩn hóa SOP |
📂 General
| English | Tiếng Việt |
|---|---|
| %GRR > 30% & %EV cao | Thiết bị không ổn |
| %GRR > 30% & %EV cao | Thiết bị không ổn | Hiệu chuẩn, nâng cấp thiết bị | %GRR > 30% & %EV cao | Thiết bị không ổn | Hiệu chuẩn, nâng cấp thiết bị |
📂 General
| English | Tiếng Việt |
|---|---|
| %GRR < 10% | Hệ thống đo xuất sắc |
| %GRR < 10% | Hệ thống đo xuất sắc | %GRR < 10% | Hệ thống đo xuất sắc |
📂 General
& (4)
| English | Tiếng Việt |
|---|---|
| > 30% | Unacceptable |
| > 30% | Unacceptable | Measurement system must be improved before use | > 30% | Unacceptable | Measurement system must be improved before use |
📂 General
| English | Tiếng Việt |
|---|---|
| >= 1.67 | Excellent — process du dung sai |
| >= 1.67 | Excellent — process du dung sai | Maintain, reduce inspection | >= 1.67 | Excellent — process du dung sai | Maintain, reduce inspection |
📂 AI/Digital
| English | Tiếng Việt |
|---|---|
| < 1.0 | Reject — not enough capability |
| < 1.0 | Reject — not enough capability | Major improvement needed | < 1.0 | Reject — not enough capability | Major improvement needed |
📂 Quality Management
| English | Tiếng Việt |
|---|---|
| < 10% | Excellent |
| < 10% | Excellent | Measurement system acceptable for all purposes | < 10% | Excellent | Measurement system acceptable for all purposes |
📂 General
0 (3)
| English | Tiếng Việt |
|---|---|
| 0.0 – 0.3 | Missed |
| 0.0 – 0.3 | Missed | Investigate: wrong OKR? wrong approach? resources? | 0.0 – 0.3 | Missed | Investigate: wrong OKR? wrong approach? resources? |
📂 Six Sigma
| English | Tiếng Việt |
|---|---|
| 0.4 – 0.6 | Partial progress |
| 0.4 – 0.6 | Partial progress | On track but need acceleration, adjust approach | 0.4 – 0.6 | Partial progress | On track but need acceleration, adjust approach |
📂 Six Sigma
| English | Tiếng Việt |
|---|---|
| 0.7 – 0.9 | Target range |
| 0.7 – 0.9 | Target range | Good progress, maintain momentum | 0.7 – 0.9 | Target range | Good progress, maintain momentum |
📂 AI/Digital
1 (30)
| English | Tiếng Việt |
|---|---|
| 1 nhà máy (10-20 máy) | 200-500 triệu |
| 1 nhà máy (10-20 máy) | 200-500 triệu | 3-6 tháng | 30-50% | 1 nhà máy (10-20 máy) | 200-500 triệu | 3-6 tháng | 30-50% |
📂 General
| Tiếng Anh | Tiếng Việt |
|---|---|
| 1 proportion test | Kiểm định tỷ lệ 1 |
| A hypothesis test to determine whether the proportion of trials that produce a certain event is equal to a target value. This procedure tests the null hypothesis that the population proportion (p) is equal to a hypothesized value (H0: p = p0). The alternative hypothesis can be left-tailed (p < p0), right-tailed (p > p0), or two-tailed (p ≠ p0). Examples of proportion data include: | Một kiểm định giả thuyết để xác định xem tỷ lệ các thử nghiệm tạo ra một sự kiện cụ thể có bằng một giá trị mục tiêu hay không. Thủ tục này kiểm tra giả thuyết không có rằng tỷ lệ dân số (p) bằng một giá trị giả định (H0: p = p0). Giả thuyết thay thế có thể là đuôi trái (p < p0), đuôi phải (p > p0), hoặc hai đuôi (p ≠ p0). Các ví dụ về dữ liệu tỷ lệ bao gồm: |
| – The proportion of peanuts in a jar of mixed nuts | – Tỷ lệ lượng lạc trong hũ hỗn hợp hạt hạt |
| – The proportion of voters who support Candidate A in an election | – Tỷ lệ cử tri ủng hộ Ứng cử viên A trong một cuộc bầu cử |
| – The proportion of manufactured goods that pass a safety inspection | – Tỷ lệ hàng hóa được sản xuất vượt qua kiểm định an toàn |
| Suppose you are the manager of the warranty claims department in a company that manufactures TVs. You want to know whether the proportion of your company’s TVs that are defective is below the industry average of 0.045. You take a sample of 1000 TVs and observe 30 defective TVs, or a proportion of 0.03. You use a one-tailed 1 proportion test, with the following null and alternative hypotheses: | Giả sử bạn là quản lý bộ phận yêu cầu bảo hành trong một công ty sản xuất TV. Bạn muốn biết xem tỷ lệ TV bị lỗi của công ty bạn có thấp hơn trung bình ngành công nghiệp là 0,045 hay không. Bạn lấy mẫu 1000 TV và quan sát được 30 TV bị lỗi, tỷ lệ là 0,03. Bạn sử dụng một kiểm định tỷ lệ một đuôi với các giả thuyết không và thay thế sau: |
| H0: p = 0.045 | H0: p = 0,045 |
| H1: p < 0.045 | H1: p < 0,045 |
| The test produces a p-value of 0.010, so you reject the null hypothesis and conclude that the proportion of your company’s TVs that are defective is less than the industry average. | Kiểm định cho ra giá trị p-value là 0,010, vì vậy bạn bác bỏ giả thuyết không và kết luận rằng tỷ lệ TV bị lỗi của công ty bạn ít hơn so với trung bình ngành công nghiệp. |
Xem thêm: Tài liệu tham khảo liên quan
| Tiếng Anh | Tiếng Việt |
|---|---|
| 1 Variance test | Kiểm định Phương sai 1 mẫu |
| A hypothesis test to determine whether the variance of one population is equal to a target value. Its null hypothesis states that the population variance (s^2) equals a hypothesized value (H0: s^2 = s^20). The alternative hypothesis can be left-tailed (s^2 < s^20), right-tailed (s^2 > s^20), or two-tailed (s^2 ≠ s^20). | Một kiểm định giả thuyết để xác định xem phương sai của một quần thể có bằng một giá trị mục tiêu hay không. Giả thuyết không của nó cho biết rằng phương sai của quần thể (s^2) bằng một giá trị giả định (H0: s^2 = s^20). Giả thuyết thay thế có thể là đuôi trái (s^2 < s^20), đuôi phải (s^2 > s^20), hoặc hai đuôi (s^2 ≠ s^20). |
| For example, a delivery company serving one metropolitan area wants to improve its delivery estimates by reducing the variance of delivery times. A manager decides that the delivery process is unacceptable if the variance in delivery times exceeds 25 minutes², which equals a standard deviation of 5 minutes. She collects delivery time data from the past month and performs a right-tailed 1 Variance test with the following hypotheses: | Ví dụ, một công ty giao hàng phục vụ một khu vực đô thị muốn cải thiện ước tính giao hàng bằng cách giảm phương sai của thời gian giao hàng. Một người quản lý quyết định rằng quá trình giao hàng không chấp nhận được nếu phương sai trong thời gian giao hàng vượt quá 25 phút², tương đương với độ lệch chuẩn là 5 phút. Cô ấy thu thập dữ liệu thời gian giao hàng từ tháng trước và thực hiện một kiểm định Phương sai 1 mẫu theo hướng phải (right-tailed) với các giả thuyết sau: |
| H0: s^2 = 25 | H0: s^2 = 25 |
| H1: s^2 > 25 | H1: s^2 > 25 |
| The test produces a p-value of 0.50, so the manager fails to reject the null hypothesis: no evidence exists to suggest the population variance exceeds 25. The delivery process is acceptable. | Kiểm định cho ra giá trị p-value là 0,50, vì vậy người quản lý không bác bỏ giả thuyết không: không có bằng chứng nào cho thấy phương sai của quần thể vượt quá 25. Quá trình giao hàng là chấp nhận được. |
Xem thêm: Tài liệu tham khảo liên quan
| English | Tiếng Việt |
|---|---|
| 1-3 | Design records, ECN, customer approval |
| 1-3 | Design records, ECN, customer approval | Required | 1-3 | Design records, ECN, customer approval | Required |
📂 Six Sigma
| Tiếng Anh | Tiếng Việt |
|---|---|
| 1-sample Poisson test | Kiểm định Poisson một mẫu |
| A hypothesis test of the mean and occurrence rate of a population that follows the Poisson distribution, which models the number of times an event occurs in a given amount of time, area, volume, or other finite observation space. Examples of Poisson processes include: | Một kiểm định giả thuyết về giá trị trung bình và tỷ lệ xuất hiện của một quần thể tuân theo phân phối Poisson, mô hình hóa số lần một sự kiện xảy ra trong một khoảng thời gian nhất định, diện tích, khối lượng, hoặc không gian quan sát hữu hạn khác. Các ví dụ về quá trình Poisson bao gồm: |
| – The number of telephone calls a customer support center receives in one business day | – Số cuộc gọi điện thoại mà trung tâm hỗ trợ khách hàng nhận được trong một ngày làm việc |
| – The number of scratches on a car hood | – Số vết xước trên nắp capô xe hơi |
| – The blood count of a hospital patient, which counts the number of blood cells in a given volume of blood | – Số lượng tế bào máu của một bệnh nhân bệnh viện, đếm số lượng tế bào máu trong một lượng máu nhất định |
| The test’s null hypothesis states that the mean (m) or rate (l) of a Poisson population is equal to a hypothesized value (H0: l = l0). The alternative hypothesis can be left-tailed (l < l0), right-tailed (l > l0), or two-tailed (l ≠ l0). | Giả thuyết không của kiểm định cho biết rằng giá trị trung bình (m) hoặc tỷ lệ (l) của một quần thể Poisson bằng một giá trị giả định (H0: l = l0). Giả thuyết thay thế có thể là đuôi trái (l < l0), đuôi phải (l > l0), hoặc hai đuôi (l ≠ l0). |
| For example, if the number of calls to a call center is too great, many calls go unanswered and customer service declines. If the call center receives more than 30 calls per hour, the manager will recommend opening a second branch to handle the greater load. Because the number of calls per hour follows a Poisson distribution, the manager uses a 1-sample Poisson test with the following hypotheses: | Ví dụ, nếu số lượng cuộc gọi đến một trung tâm cuộc gọi quá lớn, nhiều cuộc gọi không được trả lời và dịch vụ khách hàng suy giảm. Nếu trung tâm cuộc gọi nhận được hơn 30 cuộc gọi mỗi giờ, người quản lý sẽ đề xuất mở một chi nhánh thứ hai để xử lý tải trọng lớn hơn. Vì số cuộc gọi mỗi giờ tuân theo phân phối Poisson, người quản lý sử dụng kiểm định Poisson một mẫu với các giả thuyết sau: |
| H0: l = 30 | H0: l = 30 |
| H1: l > 30 | H1: l > 30 |
| The test calculates a p-value of 0.009, so the manager rejects the null hypothesis. She concludes that the call rate is greater than 30 per hour, and recommends opening a new office to handle the calls. | Kiểm định tính toán được giá trị p-value là 0,009, vì vậy người quản lý bác bỏ giả thuyết không. Cô kết luận rằng tỷ lệ cuộc gọi lớn hơn 30 mỗi giờ, và đề xuất mở một văn phòng mới để xử lý các cuộc gọi. |
Xem thêm: Tài liệu tham khảo liên quan
| Tiếng Anh | Tiếng Việt |
|---|---|
| 1-sample sign test | Kiểm định dấu mẫu đơn |
| A hypothesis test for the median of a single population. The procedure uses the null hypothesis that the population median (h) is equal to a hypothesized value (H0: h = h0), and tests it against an alternative hypothesis, which can be left-tailed (h < h0), right-tailed (h > h0), or two-tailed (h ≠ h0). | Một kiểm định giả thuyết cho trung vị của một quần thể duy nhất. Thủ tục sử dụng giả thuyết không rằng trung vị của quần thể (h) bằng một giá trị giả định (H0: h = h0), và kiểm tra nó so với một giả thuyết thay thế, có thể là đuôi trái (h < h0), đuôi phải (h > h0), hoặc hai đuôi (h ≠ h0). |
| The 1-sample sign test is a nonparametric analog of the 1-sample t-test because it does not require the data to come from a normally distributed population, as the t-test does. Furthermore, the 1-sample sign test makes no assumptions about population symmetry. | Kiểm định dấu mẫu đơn là một phép tương đồng không tham số của kiểm định t- mẫu đơn vì nó không yêu cầu dữ liệu đến từ một quần thể có phân phối chuẩn, như kiểm định t làm. Hơn nữa, kiểm định dấu mẫu đơn không đặt ra giả định về đối xứng của quần thể. |
| For example, the Human Resources department of a large company analyzes its payroll to determine whether the company’s median salary differs from the industry average of $45,000. Salary data are right-skewed, with many workers earning lower salaries and only a few executives earning high salaries. Because the data are nonnormal and asymmetric, the consultant chooses the nonparametric 1-sample sign test with these hypotheses: H0: h = 45000 and H0: h ≠ 45000. If the test’s p-value is less than your chosen significance level, you can reject the null hypothesis and conclude that the median salary differs from the industry average. | Ví dụ, phòng Nhân sự của một công ty lớn phân tích bảng lương để xác định xem mức lương trung bình của công ty khác biệt so với mức lương trung bình ngành là $45,000. Dữ liệu lương có độ lệch phải, với nhiều công nhân kiếm lương thấp và chỉ có một vài quản lý cấp cao kiếm lương cao. Vì dữ liệu không chuẩn và không đối xứng, nhà tư vấn chọn kiểm định dấu mẫu đơn không tham số với các giả thuyết sau: H0: h = 45000 và H0: h ≠ 45000. Nếu giá trị p của kiểm định nhỏ hơn mức ý nghĩa bạn chọn, bạn có thể bác bỏ giả thuyết không và kết luận rằng mức lương trung vị khác biệt so với mức lương trung bình ngành. |
Xem thêm: Tài liệu tham khảo liên quan
| Tiếng Anh | Tiếng Việt |
|---|---|
| 1-sample t-test | Kiểm định t mẫu đơn |
| Compares the sample mean to a hypothesized value. For example, a soft-drink company claims that on average its 12-ounce can of soda contains 20 calories. You can use a 1-sample t-test to assess whether the manufacturer’s claim is not true. | So sánh giá trị trung bình mẫu với một giá trị giả định. Ví dụ, một công ty sản xuất đồ uống có ga tuyên bố rằng trên trung bình, lon nước ngọt 12 ounce của họ chứa 20 calo. Bạn có thể sử dụng kiểm định t mẫu đơn để đánh giá xem tuyên bố của nhà sản xuất có đúng không. |
| 1-sample t-test compares the sample mean to the hypothesized value relative to the variability in the sample. The results indicate whether the difference between the values is statistically significant. | Kiểm định t mẫu đơn so sánh giá trị trung bình mẫu với giá trị giả định liên quan đến sự biến động trong mẫu. Kết quả cho biết xem sự khác biệt giữa các giá trị có ý nghĩa thống kê hay không. |
| Use 1-sample t-test when: | Sử dụng kiểm định t mẫu đơn khi: |
| – Population standard deviation is unknown | – Độ lệch chuẩn của quần thể không được biết |
| – Sample is randomly drawn from a population | – Mẫu được rút ngẫu nhiên từ một quần thể |
Xem thêm: Tài liệu tham khảo liên quan
| Tiếng Anh | Tiếng Việt |
|---|---|
| 1-sample Wilcoxon test | Kiểm định Wilcoxon một mẫu |
| A nonparametric hypothesis test for the median of a single population. The procedure uses the null hypothesis that the population median (h) is equal to a hypothesized value (H0: h = h0), and tests it against an alternative hypothesis, which can be either left-tailed (h < h0), right-tailed (h > h0), or two-tailed (h ≠ h0). | Một kiểm định giả thuyết không tham số cho trung vị của một quần thể duy nhất. Thủ tục sử dụng giả thuyết không rằng trung vị của quần thể (h) bằng một giá trị giả định (H0: h = h0), và kiểm tra nó so với một giả thuyết thay thế, có thể là đuôi trái (h < h0), đuôi phải (h > h0), hoặc hai đuôi (h ≠ h0). |
| For example, suppose you are a statistician for a company that administers standardized tests for students, and you want to know whether the test’s median score has changed from the historical value of 50. You select a sample of students to take the standardized test and observe a median score of 60. You perform a 1-sample Wilcoxon test on this sample, with these hypotheses: H0: h = 50 and H0: h ≠ 50. If the test’s p-value is less than your chosen significance level, you can reject the null hypothesis and conclude that the median score has changed. | Ví dụ, giả sử bạn là một nhà thống kê cho một công ty tổ chức bài kiểm tra chuẩn hóa cho sinh viên, và bạn muốn biết xem điểm trung vị của bài kiểm tra đã thay đổi so với giá trị lịch sử là 50. Bạn chọn một mẫu sinh viên để tham gia bài kiểm tra chuẩn hóa và quan sát được điểm trung vị là 60. Bạn thực hiện kiểm định Wilcoxon một mẫu trên mẫu dữ liệu này, với các giả thuyết sau: H0: h = 50 và H0: h ≠ 50. Nếu giá trị p của kiểm định nhỏ hơn mức ý nghĩa bạn chọn, bạn có thể bác bỏ giả thuyết không và kết luận rằng điểm trung vị đã thay đổi. |
| The 1-sample Wilcoxon test is a nonparametric analog of the 1-sample t-test because it does not require the data to come from a normally distributed population, as the t-test does. However, the 1-sample Wilcoxon test also assumes the data comes from a symmetric distribution, such as the uniform or Cauchy distributions. If you cannot justify this assumption of symmetry, use the nonparametric 1-sample sign test, which does not assume a symmetric distribution. | Kiểm định Wilcoxon một mẫu là một bản sao không tham số của kiểm định t mẫu đơn vì nó không yêu cầu dữ liệu đến từ một quần thể có phân phối chuẩn, như kiểm định t. Tuy nhiên, kiểm định Wilcoxon một mẫu cũng giả định rằng dữ liệu đến từ một phân phối đối xứng, như phân phối đồng đều hoặc phân phối Cauchy. Nếu bạn không thể chứng minh được giả định về tính đối xứng này, hãy sử dụng kiểm định dấu mẫu không tham số, không giả định về phân phối đối xứng. |
Xem thêm: Tài liệu tham khảo liên quan
| Tiếng Anh | Tiếng Việt |
|---|---|
| 1-sample Z-test | Kiểm định Z một mẫu |
| Tests whether a normal population mean is equal to a target value. This test requires the population variance to be known; if you do not know the population variance, use the 1-sample t-test instead. The 1-sample Z-test uses the null hypothesis that the population mean (m) is equal to a hypothesized value (H0: m = m0), and tests it against an alternative hypothesis, which can be either left-tailed (m < m0), right-tailed (m > m0), or two-tailed (m ≠ m0). | Kiểm định xem giá trị trung bình của một quần thể chuẩn có bằng một giá trị mục tiêu hay không. Kiểm định này yêu cầu phương sai của quần thể phải được biết; nếu bạn không biết phương sai của quần thể, hãy sử dụng kiểm định t một mẫu thay thế. Kiểm định Z một mẫu sử dụng giả thuyết không rằng giá trị trung bình của quần thể (m) bằng một giá trị giả định (H0: m = m0), và kiểm tra nó so với một giả thuyết thay thế, có thể là đuôi trái (m < m0), đuôi phải (m > m0), hoặc hai đuôi (m ≠ m0). |
| For example, results of IQ tests and other standardized tests often have a known population variance. Suppose millions of students take a certain standardized test every year, in which scores range from 0 to 100. A group of 40 students takes the test and obtains a mean score of 85. You want to determine whether this score is statistically different than the national average of 80. Historical results indicate the population variance to be 100. Because the population variance is known, the 1-sample Z-test is appropriate. | Ví dụ, kết quả của các bài kiểm tra IQ và các bài kiểm tra chuẩn hóa khác thường có phương sai của quần thể được biết đến. Giả sử hàng triệu học sinh tham gia một bài kiểm tra chuẩn hóa nhất định hàng năm, trong đó điểm số dao động từ 0 đến 100. Một nhóm 40 học sinh tham gia bài kiểm tra và đạt được điểm trung bình là 85. Bạn muốn xác định xem điểm này có khác biệt thống kê so với trung bình quốc gia là 80 hay không. Kết quả lịch sử cho thấy phương sai của quần thể là 100. Bởi vì phương sai của quần thể được biết đến, kiểm định Z một mẫu là phù hợp. |
Xem thêm: Tài liệu tham khảo liên quan
| English | Tiếng Việt |
|---|---|
| 1. Assess | Month 1 |
| 1. Assess | Month 1 | Current state map, finance Gemba, pain points, pilot stream selection | Assessment report, pilot charter | 1. Assess | Month 1 | Current state map, finance Gemba, pain points, pilot stream selection | Assessment report, pilot charter |
📂 Lean
| English | Tiếng Việt |
|---|---|
| 1. Auto Maint | Nhan vien tu bao tri |
| 1. Auto Maint | Nhan vien tu bao tri | Sach se, kiem tra, phat hien som | 1. Auto Maint | Nhan vien tu bao tri | Sach se, kiem tra, phat hien som |
📂 AI/Digital
| English | Tiếng Việt |
|---|---|
| 1. Awareness | 1-2 months |
| 1. Awareness | 1-2 months | Executive education, finance Gemba walks, pilot stream selection | Business case, pilot charter | 1. Awareness | 1-2 months | Executive education, finance Gemba walks, pilot stream selection | Business case, pilot charter |
📂 Lean
| English | Tiếng Việt |
|---|---|
| 1. Compliance | Tools forced, 5S = audit, fear-based |
| 1. Compliance | Tools forced, 5S = audit, fear-based | Basic standards, visual management | 1. Compliance | Tools forced, 5S = audit, fear-based | Basic standards, visual management |
📂 Lean
| English | Tiếng Việt |
|---|---|
| 1. Contact | Physical shape/size match |
| 1. Contact | Physical shape/size match | Asymmetric key, guide pin, fixture shape | 1. Contact | Physical shape/size match | Asymmetric key, guide pin, fixture shape |
📂 General
| English | Tiếng Việt |
|---|---|
| 1. Customer Requirements (WHATs) | Voice of Customer, priority rating |
| 1. Customer Requirements (WHATs) | Voice of Customer, priority rating | Easy to install, Durable, Affordable | 1. Customer Requirements (WHATs) | Voice of Customer, priority rating | Easy to install, Durable, Affordable |
📂 Six Sigma
| English | Tiếng Việt |
|---|---|
| 1. Detect | Phat hien abnormality |
| 1. Detect | Phat hien abnormality | Sensor, vision, torque monitor | 1. Detect | Phat hien abnormality | Sensor, vision, torque monitor |
📂 General
| English | Tiếng Việt |
|---|---|
| 1. Equipment Failure | Availability |
| 1. Equipment Failure | Availability | TPM Planned Maintenance | 1. Equipment Failure | Availability | TPM Planned Maintenance |
📂 TPM
| English | Tiếng Việt |
|---|---|
| 1. Initial Cleaning | Clean to inspect, tag abnormalities |
| 1. Initial Cleaning | Clean to inspect, tag abnormalities | Clean equipment, red tags | 1. Initial Cleaning | Clean to inspect, tag abnormalities | Clean equipment, red tags |
📂 Lean
| English | Tiếng Việt |
|---|---|
| 1. Lean First | Eliminate waste, standardize process |
| 1. Lean First | Eliminate waste, standardize process | 5S , Standard Work, VSM , Kaizen | 1. Lean First | Eliminate waste, standardize process | 5S , Standard Work, VSM , Kaizen |
📂 Lean
| English | Tiếng Việt |
|---|---|
| 1. Reactive | Firefighting, incoming inspection only |
| 1. Reactive | Firefighting, incoming inspection only | Detect defects at receiving | 1. Reactive | Firefighting, incoming inspection only | Detect defects at receiving |
📂 General
| English | Tiếng Việt |
|---|---|
| 1. Registration | Front desk |
| 1. Registration | Front desk | 5 min | 15 min | NVA wait | Forms, queue | 1. Registration | Front desk | 5 min | 15 min | NVA wait | Forms, queue |
📂 AI/Digital
| English | Tiếng Việt |
|---|---|
| 1. Separate | Classify tasks: internal vs external |
| 1. Separate | Classify tasks: internal vs external | Remove external from changeover time | 1. Separate | Classify tasks: internal vs external | Remove external from changeover time |
📂 General
| English | Tiếng Việt |
|---|---|
| 1. True North | Top center |
| 1. True North | Top center | Vision, mission, values | 10+ years | 1. True North | Top center | Vision, mission, values | 10+ years |
📂 General
| English | Tiếng Việt |
|---|---|
| 1. Vision | 3-5 year |
| 1. Vision | 3-5 year | Leadership define True North, Breakthrough Objectives | 3-5 breakthrough goals | 1. Vision | 3-5 year | Leadership define True North, Breakthrough Objectives | 3-5 breakthrough goals |
📂 General
| English | Tiếng Việt |
|---|---|
| 1.33 | Minimum acceptable (PPAP) |
| 1.33 | Minimum acceptable (PPAP) | Monitor, standard work | 1.33 | Minimum acceptable (PPAP) | Monitor, standard work |
📂 Lean
| English | Tiếng Việt |
|---|---|
| 10 +/- 0.5 | 10.25 |
| 10 +/- 0.5 | 10.25 | 0.08 | 2.08 | 1.04 | Borderline (shifted) | 10 +/- 0.5 | 10.25 | 0.08 | 2.08 | 1.04 | Borderline (shifted) |
📂 General
| English | Tiếng Việt |
|---|---|
| 10-30% | Acceptable |
| 10-30% | Acceptable | Depends on application (critical vs non-critical) | 10-30% | Acceptable | Depends on application (critical vs non-critical) |
📂 Six Sigma
| English | Tiếng Việt |
|---|---|
| 100% In-person | 85% |
| 100% In-person | 85% | High | High | Teams, hands-on stats, DOE | 100% In-person | 85% | High | High | Teams, hands-on stats, DOE |
📂 Six Sigma
| English | Tiếng Việt |
|---|---|
| 12-18 | Lab, AAR, Samples, PSW |
| 12-18 | Lab, AAR, Samples, PSW | Required | 12-18 | Lab, AAR, Samples, PSW | Required |
📂 General
| English | Tiếng Việt |
|---|---|
| 160+ Project Templates | Proven methodologies |
| 160+ Project Templates | Proven methodologies | Reduce implementation risk | 160+ Project Templates | Proven methodologies | Reduce implementation risk |
📂 General
2 (24)
| English | Tiếng Việt |
|---|---|
| 2 means (independent) | 2 groups |
| 2 means (independent) | 2 groups | Continuous, normal | 2-Sample t-test | 2 means (independent) | 2 groups | Continuous, normal | 2-Sample t-test |
📂 General
| English | Tiếng Việt |
|---|---|
| 2 means (paired) | Same group, before/after |
| 2 means (paired) | Same group, before/after | Continuous, normal | Paired t-test | 2 means (paired) | Same group, before/after | Continuous, normal | Paired t-test |
📂 AI/Digital
| Tiếng Anh | Tiếng Việt |
|---|---|
| 2 proportion test | Kiểm định 2 tỉ lệ |
| A hypothesis test for two population proportions to determine whether they are significantly different. This procedure uses the null hypothesis that the difference between two population proportions is equal to a hypothesized value (H0: p1 – p2 = P0), and tests it against an alternative hypothesis, which can be either left-tailed (p1 – p2 < P0), right-tailed (p1 – p2 > P0), or two-tailed (p1 – p2 ≠ P0 ). | Một kiểm định giả thuyết cho hai tỉ lệ dân số để xác định xem chúng có khác nhau có ý nghĩa thống kê hay không. Thủ tục này sử dụng giả thuyết không rằng sự khác biệt giữa hai tỉ lệ dân số bằng một giá trị giả định (H0: p1 – p2 = P0), và kiểm tra nó so với một giả thuyết thay thế, có thể là đuôi trái (p1 – p2 < P0), đuôi phải (p1 – p2 > P0), hoặc hai đuôi (p1 – p2 ≠ P0 ). |
| For example, suppose Candidate A is running in a local election. You want to determine whether a person’s gender affects their vote, so you take two samples – one of men and one of women – and observe that 55% of men and 45% of women support Candidate A. You can use the 2 proportion test to determine whether this observed difference is statistically significant. The hypotheses of a two-tailed test would be: | Ví dụ, giả sử Ứng cử viên A đang tranh cử trong một cuộc bầu cử địa phương. Bạn muốn xác định xem giới tính của một người có ảnh hưởng đến sự bỏ phiếu của họ không, vì vậy bạn lấy hai mẫu – một mẫu của nam và một mẫu của nữ – và quan sát thấy rằng 55% nam và 45% phụ nữ ủng hộ Ứng cử viên A. Bạn có thể sử dụng kiểm định 2 tỉ lệ để xác định xem sự khác biệt này có ý nghĩa thống kê hay không. Các giả thuyết của một kiểm định hai đuôi sẽ là: |
| H0: pm – pw = 0 (the proportion of men who support Candidate A is equal to the proportion of women who support Candidate A) | H0: pm – pw = 0 (tỷ lệ của nam ủng hộ Ứng cử viên A bằng với tỷ lệ của nữ ủng hộ Ứng cử viên A) |
| H1: pm – pw ≠ 0 (the proportion of men who support Candidate A is not equal to the proportion of women who support Candidate A) | H1: pm – pw ≠ 0 (tỷ lệ của nam ủng hộ Ứng cử viên A không bằng với tỷ lệ của nữ ủng hộ Ứng cử viên A) |
Xem thêm: Tài liệu tham khảo liên quan
| Tiếng Anh | Tiếng Việt |
|---|---|
| 2 variances test | Kiểm định 2 phương sai |
| A hypothesis test to determine whether two population variances are significantly different. This procedure uses the null hypothesis that the two variances are equal (H0: s21 = s22), and tests it against an alternative, which can be left-tailed (s21 < s22), right-tailed (s21 > s22), or two-tailed (s21 ≠ s22). | Một kiểm định giả thuyết để xác định xem hai phương sai của quần thể có khác nhau có ý nghĩa thống kê hay không. Thủ tục này sử dụng giả thuyết không rằng hai phương sai bằng nhau (H0: s21 = s22), và kiểm tra nó so với một giả thuyết thay thế, có thể là đuôi trái (s21 < s22), đuôi phải (s21 > s22), hoặc hai đuôi (s21 ≠ s22). |
| For example, suppose managers of a car manufacturer are deciding whether to switch to a new camshaft vendor (Vendor A) that claims they produce camshafts with less variance in diameter than the current vendor (Vendor B). Safety regulations set tight specification limits for camshaft diameter; therefore, the managers should choose the vendor with less variance in camshaft diameter. They collect a sample of camshafts from both vendors and perform a one-tailed 2 variances test on the data, with the following hypotheses: | Ví dụ, giả sử các quản lý của một nhà sản xuất ô tô đang quyết định có chuyển đổi sang một nhà cung cấp trục cam mới (Nhà cung cấp A) có tuyên bố rằng họ sản xuất trục cam có phương sai đường kính nhỏ hơn so với nhà cung cấp hiện tại (Nhà cung cấp B). Quy định an toàn đặt giới hạn thông số chặt chẽ cho đường kính trục cam; do đó, các quản lý nên chọn nhà cung cấp có phương sai ít hơn cho đường kính trục cam. Họ thu thập mẫu trục cam từ cả hai nhà cung cấp và thực hiện một kiểm định 2 phương sai một đuôi trên dữ liệu, với các giả thuyết sau: |
| H0: s2A = s2B (the two vendors produce camshafts with equal variance in diameter) | H0: s2A = s2B (hai nhà cung cấp sản xuất trục cam có phương sai đường kính bằng nhau) |
| H1: s2A < s2B (Vendor A’s claim that they have the lesser variance in camshaft diameter) | H1: s2A < s2B (Tuyên bố của Nhà cung cấp A rằng họ có phương sai đường kính trục cam nhỏ hơn) |
| If the test rejects the null hypothesis, the managers conclude that Vendor A has the smaller variance of camshaft diameter. This test is also useful for verifying assumptions of equal variance, which is the foundation of some statistical procedures. It is also useful for quality improvement situations: you can use this test to compare variance within subgroups to variance between subgroups. Also, you can use this test to compare process variance before and after implementation of a quality improvement program. | Nếu kiểm định bác bỏ giả thuyết không, các quản lý kết luận rằng Nhà cung cấp A có phương sai đường kính trục cam nhỏ hơn. Kiểm định này cũng hữu ích để xác minh giả định về phương sai bằng nhau, đó là nền tảng của một số thủ tục thống kê. Nó cũng hữu ích trong tình huống cải tiến chất lượng: bạn có thể sử dụng kiểm định này để so sánh phương sai trong các nhóm con so với phương sai giữa các nhóm con. Ngoài ra, bạn có thể sử dụng kiểm định này để so sánh phương sai quá trình trước và sau khi triển khai chương trình cải tiến chất lượng. |
Xem thêm: Tài liệu tham khảo liên quan
| English | Tiếng Việt |
|---|---|
| 2-3 | Minor effect |
| 2-3 | Minor effect | Low (1 in 100K) | High detection probability | 2-3 | Minor effect | Low (1 in 100K) | High detection probability |
📂 AI/Digital
| Tiếng Anh | Tiếng Việt |
|---|---|
| 2-sample Poisson test | Kiểm định Poisson 2 mẫu |
| A hypothesis test to compare the means or occurrence rates of two Poisson-distributed populations and determine whether they are significantly different. The Poisson distribution models the number of times an event occurs in a given amount of time, area, volume, or other observation space. | Một kiểm định giả thuyết để so sánh giá trị trung bình hoặc tỷ lệ xuất hiện của hai quần thể theo phân phối Poisson và xác định xem chúng có khác nhau có ý nghĩa thống kê hay không. Phân phối Poisson mô hình hóa số lần một sự kiện xảy ra trong một khoảng thời gian, diện tích, thể tích, hoặc không gian quan sát khác. |
| Examples of Poisson processes include: | Các ví dụ về quá trình Poisson bao gồm: |
| – The number of vehicles that pass through a highway’s toll gate in one hour | – Số lượng phương tiện đi qua cổng thu phí trên cao tốc trong một giờ |
| – The number of visitors to a website in one day | – Số lượng khách truy cập trang web trong một ngày |
| – The number of fish an ocean survey finds in a given volume of water | – Số lượng cá mà một cuộc khảo sát đại dương tìm thấy trong một thể tích nước cụ thể |
| The test’s null hypothesis states that the means (m) or rates (l) of two Poisson processes are equal (H0: l1 = l2). The alternative hypothesis can be left-tailed (l1 < l2), right-tailed (l1 > l2), or two-tailed (l1 ≠ l2). | Giả thuyết không của kiểm định cho rằng giá trị trung bình (m) hoặc tỷ lệ (l) của hai quá trình Poisson bằng nhau (H0: l1 = l2). Giả thuyết thay thế có thể là đuôi trái (l1 < l2), đuôi phải (l1 > l2), hoặc hai đuôi (l1 ≠ l2). |
| For example, a traffic safety advocate claims that Elm Street, which has no sidewalks, handles more traffic than nearby Main Street, which does have sidewalks. To prove her assertion, each weekday for a month the safety advocate counts the number of cars that travel on each street. These counts follow Poisson distributions, so she compares the amount of traffic on each street with a 2-sample Poisson test, using the following hypotheses: | Ví dụ, một người ủng hộ an toàn giao thông cho rằng Elm Street, không có vỉa hè, xử lý lưu lượng giao thông nhiều hơn so với Main Street gần đó, có vỉa hè. Để chứng minh sự khẳng định của mình, mỗi ngày làm việc trong một tháng, người ủng hộ an toàn giao thông đếm số xe ô tô đi qua trên mỗi con đường. Các đếm này tuân theo phân phối Poisson, vì vậy cô ấy so sánh lưu lượng giao thông trên mỗi con đường bằng một kiểm định Poisson 2 mẫu, sử dụng các giả thuyết sau: |
| H0: λ Elm = λ Main | H0: λ Elm = λ Main |
| H1: λ Elm > λ Main | H1: λ Elm > λ Main |
| This right-tailed test calculates a p-value of 0.02, so she rejects the null hypothesis and concludes that Elm Street has more traffic than Main Street. Because of this statistically significant evidence, authorities agree to install sidewalks on Elm Street. | Kiểm định có đuôi phải này tính toán giá trị p-value là 0,02, vì vậy cô ấy bác bỏ giả thuyết không và kết luận rằng Elm Street có nhiều lưu lượng giao thông hơn Main Street. Do bằng chứng thống kê có ý nghĩa này, các cơ quan chức năng đồng ý lắp đặt vỉa hè trên Elm Street. |
Xem thêm: Tài liệu tham khảo liên quan
| Tiếng Anh | Tiếng Việt |
|---|---|
| 2-sample t-test | Kiểm định t 2 mẫu |
| A hypothesis test for two population means to determine whether they are significantly different. This procedure uses the null hypothesis that the difference between two population means is equal to a hypothesized value (H0: m1 – m2 = m0), and tests it against an alternative hypothesis, which can be left-tailed (m1 – m2 < m0), right-tailed (m1 – m2 > m0), or two-tailed (m1 – m2 ≠ m0). | Một kiểm định giả thuyết cho hai giá trị trung bình của quần thể để xác định xem chúng có khác nhau có ý nghĩa thống kê hay không. Thủ tục này sử dụng giả thuyết không rằng sự khác biệt giữa hai giá trị trung bình của quần thể bằng một giá trị giả định (H0: m1 – m2 = m0), và kiểm tra nó so với một giả thuyết thay thế, có thể là đuôi trái (m1 – m2 < m0), đuôi phải (m1 – m2 > m0), hoặc hai đuôi (m1 – m2 ≠ m0). |
| For example, suppose you want to compare two car manufacturers – Company A and Company B – to determine which makes stronger seatbelts. You take a sample of seatbelts from both companies and measure the mean amount of force needed to break them. The 2-sample t-test analyzes the difference between these two means to determine whether the difference is statistically significant. The hypotheses of a two-tailed test would be: | Ví dụ, giả sử bạn muốn so sánh hai nhà sản xuất ô tô – Công ty A và Công ty B – để xác định cái nào làm dây an toàn mạnh hơn. Bạn lấy mẫu dây an toàn từ cả hai công ty và đo lường giá trị trung bình của lực cần thiết để phá vỡ chúng. Kiểm định t 2 mẫu phân tích sự khác biệt giữa hai giá trị trung bình này để xác định xem sự khác biệt có ý nghĩa thống kê hay không. Các giả thuyết của một kiểm định hai đuôi sẽ là: |
| H0: m1 – m2 = 0 (seatbelt strengths from both companies are equal) | H0: m1 – m2 = 0 (sức mạnh của dây an toàn từ cả hai công ty là bằng nhau) |
| H1: m1 – m2 ≠ 0 (seatbelt strengths from both companies are different) | H1: m1 – m2 ≠ 0 (sức mạnh của dây an toàn từ cả hai công ty là khác nhau) |
| If the test’s p-value is less than your chosen significance level, you should reject the null hypothesis. To conduct a 2-sample t-test, the two populations must be independent; in other words, the observations from the first sample must not have any bearing on the observations from the second sample. For example, test scores of two separate groups of students are independent, but before-and-after measurements on the same group of students are not independent, although both of these examples feature two samples. If you cannot support the assumption of sample independence, reconstruct your experiment to use the Paired t-test for dependent populations. | Nếu giá trị p-value của kiểm định nhỏ hơn mức ý nghĩa bạn đã chọn, bạn nên bác bỏ giả thuyết không. Để tiến hành kiểm định t 2 mẫu, hai quần thể phải độc lập; nghĩa là, các quan sát từ mẫu đầu tiên không được ảnh hưởng đến các quan sát từ mẫu thứ hai. Ví dụ, điểm số kiểm tra của hai nhóm học sinh riêng biệt là độc lập, nhưng đo lường trước và sau trên cùng một nhóm học sinh không độc lập, mặc dù cả hai ví dụ này đều có hai mẫu. Nếu bạn không thể hỗ trợ giả định về độc lập của mẫu, xây dựng lại thí nghiệm của bạn để sử dụng Kiểm định t dành cho các quần thể phụ thuộc. |
Xem thêm: Tài liệu tham khảo liên quan
| English | Tiếng Việt |
|---|---|
| 2. Annual Plan | Annual |
| 2. Annual Plan | Annual | Breakthrough -> Annual hoshin (3-5 objectives) | Annual objectives + KPIs | 2. Annual Plan | Annual | Breakthrough -> Annual hoshin (3-5 objectives) | Annual objectives + KPIs |
📂 KPI/OKR/BSC
| English | Tiếng Việt |
|---|---|
| 2. Breakthrough Goals | Top left |
| 2. Breakthrough Goals | Top left | 3-5 year strategic objectives | 3-5 years | 2. Breakthrough Goals | Top left | 3-5 year strategic objectives | 3-5 years |
📂 General
| English | Tiếng Việt |
|---|---|
| 2. Countermeasures | Fix root causes of contamination |
| 2. Countermeasures | Fix root causes of contamination | Eliminate sources of dirt/leak | 2. Countermeasures | Fix root causes of contamination | Eliminate sources of dirt/leak |
📂 General
| English | Tiếng Việt |
|---|---|
| 2. Digitize | Replace paper/manual with digital |
| 2. Digitize | Replace paper/manual with digital | MES, ERP, digital forms, e-signatures | 2. Digitize | Replace paper/manual with digital | MES, ERP, digital forms, e-signatures |
📂 ERP/Software
| English | Tiếng Việt |
|---|---|
| 2. Engagement | Employees participate, suggestions flow |
| 2. Engagement | Employees participate, suggestions flow | Daily huddles, A3 coaching, TWI | 2. Engagement | Employees participate, suggestions flow | Daily huddles, A3 coaching, TWI |
📂 Lean
| English | Tiếng Việt |
|---|---|
| 2. Fixed Value | Count specific operations |
| 2. Fixed Value | Count specific operations | Counter, timer, sequence checker | 2. Fixed Value | Count specific operations | Counter, timer, sequence checker |
📂 General
| English | Tiếng Việt |
|---|---|
| 2. Foundation | Month 3-6 |
| 2. Foundation | Month 3-6 | 5S, Standard Work, Visual Mgmt | Workplace organized, problems visible | 2. Foundation | Month 3-6 | 5S, Standard Work, Visual Mgmt | Workplace organized, problems visible |
📂 Lean
| English | Tiếng Việt |
|---|---|
| 2. Pilot | Month 3-6 |
| 2. Pilot | Month 3-6 | Pilot 1 area (ED, OR, ward), Kaizen events, standard work, visual mgmt | Door-to-doc -50%, LOS -10% | 2. Pilot | Month 3-6 | Pilot 1 area (ED, OR, ward), Kaizen events, standard work, visual mgmt | Door-to-doc -50%, LOS -10% |
📂 Lean
| English | Tiếng Việt |
|---|---|
| 2. Planned Maint | Bao tri ke hoach |
| 2. Planned Maint | Bao tri ke hoach | Zero Breakdown | 2. Planned Maint | Bao tri ke hoach | Zero Breakdown |
📂 AI/Digital
| English | Tiếng Việt |
|---|---|
| 2. Proactive | PPAP, audit, scorecard |
| 2. Proactive | PPAP, audit, scorecard | Prevent defects at supplier | 2. Proactive | PPAP, audit, scorecard | Prevent defects at supplier |
📂 Six Sigma
| English | Tiếng Việt |
|---|---|
| 2. Setup & Adjustment | Availability |
| 2. Setup & Adjustment | Availability | SMED | 2. Setup & Adjustment | Availability | SMED |
📂 Lean
| English | Tiếng Việt |
|---|---|
| 2. Stop | Machine tu dong dung |
| 2. Stop | Machine tu dong dung | Auto-stop, safety interlock | 2. Stop | Machine tu dong dung | Auto-stop, safety interlock |
📂 General
| English | Tiếng Việt |
|---|---|
| 2. Systematic | Standard tools, some coaching, pilot areas |
| 2. Systematic | Standard tools, some coaching, pilot areas | Consistency, capability building | 2. Systematic | Standard tools, some coaching, pilot areas | Consistency, capability building |
📂 Quality Management
| English | Tiếng Việt |
|---|---|
| 2. Technical Descriptors (HOWs) | Engineering characteristics |
| 2. Technical Descriptors (HOWs) | Engineering characteristics | Weight (kg), Cycle time (sec), Cost ($) | 2. Technical Descriptors (HOWs) | Engineering characteristics | Weight (kg), Cycle time (sec), Cost ($) |
📂 General
| English | Tiếng Việt |
|---|---|
| 2. Triage | Nurse station |
| 2. Triage | Nurse station | 10 min | 0 | VA | Standardization needed | 2. Triage | Nurse station | 10 min | 0 | VA | Standardization needed |
📂 General
| English | Tiếng Việt |
|---|---|
| 2+ proportions | 2+ groups |
| 2+ proportions | 2+ groups | Attribute | Chi-square test | 2+ proportions | 2+ groups | Attribute | Chi-square test |
📂 General
| English | Tiếng Việt |
|---|---|
| 200+ AI Apps | Pre-built AI solutions for every function |
| 200+ AI Apps | Pre-built AI solutions for every function | Deploy in days, not months | 200+ AI Apps | Pre-built AI solutions for every function | Deploy in days, not months |
📂 Six Sigma
3 (22)
| English | Tiếng Việt |
|---|---|
| 3-Minute Cleanup | Dọn dẹp 3 phút |
| A practice of taking just 3 minutes at shift end to return items and clean the work area. | Thực hành chỉ dành 3 phút cuối ca để trả dụng cụ về vị trí và vệ sinh khu vực làm việc. |
📂 5S/6S System
| English | Tiếng Việt |
|---|---|
| 3-way match | 2-3 ngày |
| 3-way match | 2-3 ngày | 15 phút | -97% | 3-way match | 2-3 ngày | 15 phút | -97% |
📂 General
| English | Tiếng Việt |
|---|---|
| 3. Alert | Canh bao team leader |
| 3. Alert | Canh bao team leader | Andon light, sound, notification | 3. Alert | Canh bao team leader | Andon light, sound, notification |
📂 Lean
| English | Tiếng Việt |
|---|---|
| 3. Annual Objectives | Bottom left |
| 3. Annual Objectives | Bottom left | This year targets supporting breakthrough | 1 year | 3. Annual Objectives | Bottom left | This year targets supporting breakthrough | 1 year |
📂 Six Sigma
| English | Tiếng Việt |
|---|---|
| 3. Catchball | Monthly |
| 3. Catchball | Monthly | Dialogue between levels, negotiate targets | Aligned action plans at every level | 3. Catchball | Monthly | Dialogue between levels, negotiate targets | Aligned action plans at every level |
📂 General
| English | Tiếng Việt |
|---|---|
| 3. Cleaning/Lubrication Std | Document best practices |
| 3. Cleaning/Lubrication Std | Document best practices | Standard sheet posted | 3. Cleaning/Lubrication Std | Document best practices | Standard sheet posted |
📂 Lean
| English | Tiếng Việt |
|---|---|
| 3. Evaluate | Month 5 |
| 3. Evaluate | Month 5 | Review pilot results, finance/audit alignment, ERP config changes | Go/No-go decision, scale plan | 3. Evaluate | Month 5 | Review pilot results, finance/audit alignment, ERP config changes | Go/No-go decision, scale plan |
📂 Quality Management
| English | Tiếng Việt |
|---|---|
| 3. Idling & Minor Stops | Performance |
| 3. Idling & Minor Stops | Performance | Autonomous Maintenance | 3. Idling & Minor Stops | Performance | Autonomous Maintenance |
📂 TPM
| English | Tiếng Việt |
|---|---|
| 3. Motion Step | Verify correct motion sequence |
| 3. Motion Step | Verify correct motion sequence | Step-by-step verification, sensor chain | 3. Motion Step | Verify correct motion sequence | Step-by-step verification, sensor chain |
📂 AI/Digital
| English | Tiếng Việt |
|---|---|
| 3. Optimize | Use data for optimization |
| 3. Optimize | Use data for optimization | SPC software, scheduling AI, PdM | 3. Optimize | Use data for optimization | SPC software, scheduling AI, PdM |
📂 Six Sigma
| English | Tiếng Việt |
|---|---|
| 3. Ownership | Teams own processes, self-improve |
| 3. Ownership | Teams own processes, self-improve | Autonomous improvement, peer coaching | 3. Ownership | Teams own processes, self-improve | Autonomous improvement, peer coaching |
📂 General
| English | Tiếng Việt |
|---|---|
| 3. Partnership | Joint improvement, development |
| 3. Partnership | Joint improvement, development | Grow supplier capability | 3. Partnership | Joint improvement, development | Grow supplier capability |
📂 Six Sigma
| English | Tiếng Việt |
|---|---|
| 3. Quality Maint | Bao tri chat luong |
| 3. Quality Maint | Bao tri chat luong | Zero Defect | 3. Quality Maint | Bao tri chat luong | Zero Defect |
📂 Quality Management
| English | Tiếng Việt |
|---|---|
| 3. Relationship Matrix | WHAT x HOW correlation (Strong/Medium/Weak/None) |
| 3. Relationship Matrix | WHAT x HOW correlation (Strong/Medium/Weak/None) | Easy install Weight: Strong negative | 3. Relationship Matrix | WHAT x HOW correlation (Strong/Medium/Weak/None) | Easy install Weight: Strong negative |
📂 General
| English | Tiếng Việt |
|---|---|
| 3. Scale | Month 7-12 |
| 3. Scale | Month 7-12 | Expand to all clinical areas, Daily Management, staff training | Hospital-wide metrics improve 20-30% | 3. Scale | Month 7-12 | Expand to all clinical areas, Daily Management, staff training | Hospital-wide metrics improve 20-30% |
📂 AI/Digital
| English | Tiếng Việt |
|---|---|
| 3. Stabilize | Month 6-9 |
| 3. Stabilize | Month 6-9 | SMED, TPM, Poka-yoke, SPC | Setup -60%, downtime -40%, defects -50% | 3. Stabilize | Month 6-9 | SMED, TPM, Poka-yoke, SPC | Setup -60%, downtime -40%, defects -50% |
📂 Lean
| English | Tiếng Việt |
|---|---|
| 3. Vitals | Nurse station |
| 3. Vitals | Nurse station | 8 min | 20 min | BVA/NVA | Room availability | 3. Vitals | Nurse station | 8 min | 20 min | BVA/NVA | Room availability |
📂 AI/Digital
| English | Tiếng Việt |
|---|---|
| 3+ means | 3+ groups |
| 3+ means | 3+ groups | Continuous, normal | One-way ANOVA | 3+ means | 3+ groups | Continuous, normal | One-way ANOVA |
📂 General
| English | Tiếng Việt |
|---|---|
| 360 Review | Không |
| 360 Review | Không | Cơ bản | Nâng cao | 360 Review | Không | Cơ bản | Nâng cao |
📂 General
| English | Tiếng Việt |
|---|---|
| 360-Degree Feedback | Phản hồi 360 Độ |
| A performance review method gathering feedback from supervisors, peers, and subordinates. | Phương pháp đánh giá hiệu suất thu thập phản hồi từ cấp trên, đồng nghiệp và cấp dưới. |
📂 HR / People Management
| Tiếng Anh | Tiếng Việt |
|---|---|
| 3D scatterplot | Biểu đồ phân tán 3D |
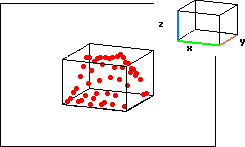
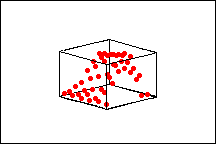
| Use to explore the potential relationship between three variables. When you create a 3D scatterplot, you usually display variables in three dimensions with predictor variables on the x-axis and y-axis and the response variable on the z-axis. | Sử dụng để khám phá mối quan hệ tiềm năng giữa ba biến số. Khi bạn tạo một biểu đồ phân tán 3D, bạn thường hiển thị biến số trong ba chiều với biến dự đoán trên trục x và trục y và biến phản ứng trên trục z. |
| For example, you may want to examine how temperature and humidity affect the drying time of paint, or how horsepower and tire pressure affect a vehicle’s fuel efficiency. | Ví dụ, bạn có thể muốn xem xét làm thế nào nhiệt độ và độ ẩm ảnh hưởng đến thời gian khô của sơn, hoặc làm thế nào công suất và áp suất lốp ảnh hưởng đến hiệu suất nhiên liệu của một phương tiện. |
| This 3D scatterplot shows how reheat time (y) and temperature (x) affect the quality (z) of a frozen entree. You can rotate a 3D scatterplot to view it from different angles. | Biểu đồ phân tán 3D này cho thấy làm thế nào thời gian nấu lại (y) và nhiệt độ (x) ảnh hưởng đến chất lượng (z) của một món động lạnh. Bạn có thể xoay biểu đồ phân tán 3D để xem nó từ các góc độ khác nhau. |
 |  |
Xem thêm: Tài liệu tham khảo liên quan
| English | Tiếng Việt |
|---|---|
| 3PL (Third-Party Logistics) | Đ第三方物流 (3PL) |
| Outsourcing logistics and distribution functions to an external provider. | Thuê ngoài các chức năng hậu cần và phân phối cho nhà cung cấp bên ngoài. |
📂 Supply Chain Management
4 (9)
| English | Tiếng Việt |
|---|---|
| 4-6 | Moderate effect |
| 4-6 | Moderate effect | Moderate (1 in 10K) | Moderate detection | 4-6 | Moderate effect | Moderate (1 in 10K) | Moderate detection |
📂 General
| English | Tiếng Việt |
|---|---|
| 4-7 | DFMEA, Process Flow, PFMEA, Control Plan |
| 4-7 | DFMEA, Process Flow, PFMEA, Control Plan | Required | 4-7 | DFMEA, Process Flow, PFMEA, Control Plan | Required |
📂 Six Sigma
| English | Tiếng Việt |
|---|---|
| 4. Automate | Automate critical steps (auto-centering, pneumatic clamps) |
| 4. Automate | Automate critical steps (auto-centering, pneumatic clamps) | Target: single-digit minutes | 4. Automate | Automate critical steps (auto-centering, pneumatic clamps) | Target: single-digit minutes |
📂 General
| English | Tiếng Việt |
|---|---|
| 4. Consult | Physician |
| 4. Consult | Physician | 15 min | 45 min | VA/NVA | Physician availability | 4. Consult | Physician | 15 min | 45 min | VA/NVA | Physician availability |
📂 AI/Digital
| English | Tiếng Việt |
|---|---|
| 4. Culture | Lean = DNA, sustainable without experts |
| 4. Culture | Lean = DNA, sustainable without experts | Teach others, extend to suppliers | 4. Culture | Lean = DNA, sustainable without experts | Teach others, extend to suppliers |
📂 Lean
| English | Tiếng Việt |
|---|---|
| 4. Fix | Root cause + corrective action |
| 4. Fix | Root cause + corrective action | 5 Why, Poka-yoke, SPC | 4. Fix | Root cause + corrective action | 5 Why, Poka-yoke, SPC |
📂 Lean
| English | Tiếng Việt |
|---|---|
| 4. Flow & Pull | Month 9-12 |
| 4. Flow & Pull | Month 9-12 | Cellular layout, Kanban, Heijunka | WIP -60%, lead time -50% | 4. Flow & Pull | Month 9-12 | Cellular layout, Kanban, Heijunka | WIP -60%, lead time -50% |
📂 Lean
| English | Tiếng Việt |
|---|---|
| 4. Focused Improv | Cai tien tap trung |
| 4. Focused Improv | Cai tien tap trung | Loai bo 6 ton that | 4. Focused Improv | Cai tien tap trung | Loai bo 6 ton that |
📂 AI/Digital
| English | Tiếng Việt |
|---|---|
| 4. General Inspection | Operator training on equipment |
| 4. General Inspection | Operator training on equipment | Multi-skilled operators | 4. General Inspection | Operator training on equipment | Multi-skilled operators |
📂 AI/Digital
· (1)
| English | Tiếng Việt |
|---|---|
| · Solutions · Storyboard | Exercises |
| · Solutions · Storyboard | Exercises | · Solutions · Storyboard | Exercises |
📂 General
⚡ (1)
| English | Tiếng Việt |
|---|---|
| ⚡ Thời gian xử lý | Ngày đóng – Ngày tạo |
| ⚡ Thời gian xử lý | Ngày đóng – Ngày tạo | ≤ 7 ngày | ⚡ Thời gian xử lý | Ngày đóng – Ngày tạo | ≤ 7 ngày |
📂 General
✉ (2)
| English | Tiếng Việt |
|---|---|
| ✉️ Email: info@cicc.com.vn | ✉️ Email: phamthanhdieu@gmail.com |
| ✉️ Email: info@cicc.com.vn | ✉️ Email: phamthanhdieu@gmail.com | ✉️ Email: info@cicc.com.vn | ✉️ Email: phamthanhdieu@gmail.com |
📂 AI/Digital
| English | Tiếng Việt |
|---|---|
| ✉ info@cicc.com.vn | ✉ dieu.pham@lean.vn |
| ✉ info@cicc.com.vn | ✉ dieu.pham@lean.vn | ✉ info@lean.vn | ✉ info@cicc.com.vn | ✉ dieu.pham@lean.vn | ✉ info@lean.vn |
📂 Lean
🎓 Học chuyên sâu hơn
Biết thuật ngữ chưa đủ — hãy học cách áp dụng thực tế