#khóa học lean ngân hàng
13 bài viết

ỨNG DỤNG LEAN SIX SIGMA TẠI NGÂN HÀNG LPBank
CiCC ĐỒNG HÀNH CÙNG LPBANK TRIỂN KHAI CHƯƠNG TRÌNH LEAN SIX SIGMA CHAMPION CHO CÁN BỘ QUẢN LÝ 📢 Hà Nội, tháng 01/2025 – ...

CHƯƠNG TRÌNH LEAN SIX SIGMA YELLOW BELT DÀNH CHO KHỐI NGÂN HÀNG TẠI TPBANK

Lean hành chính công
Trong thời đại ngày nay, các nguyên tắc và phương pháp của hệ thống tinh gọn (LEAN) đã không còn chỉ áp dụng trong lĩnh ...

Lean Ngân Hàng
Lean Six Sigma là một phương pháp quản lý chất lượng đã được áp dụng thành công trong nhiều ngành công nghiệp, bao gồm c...

Triết lý tinh gọn Lean Principles
Các nguyên tắc chủ đạo của hệ thống lean Lean Principles là một hệ thống tư duy và phương pháp làm việc tập trung vào vi...

Ứng dụng lean cải tiến dịch vụ công
Thách thức của phương pháp lean trong dịch vụ công Áp dụng phương pháp Lean trong dịch vụ công đối diện nhiều thách thức...
Tại sao Ngân hàng nên Áp dụng Lean Six Sigma?
Lean Six Sigma là một phương pháp quản lý chất lượng đã được áp dụng thành công trong nhiều ngành công nghiệp, bao gồm c...
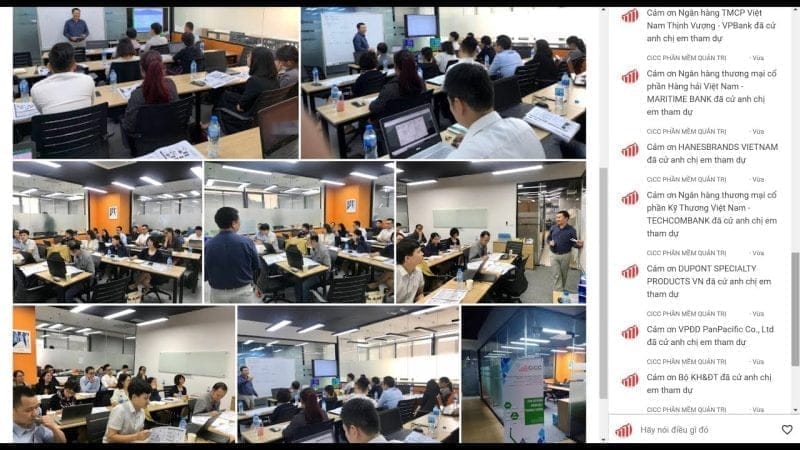
Lean Six Sigma Yellow Belt Ngân Hàng – VPBANK
Lean Six Sigma Dành Riêng Cho Khối Ngân Hàng CiCC đã được VPBank lựa chọn là đối tác đào tạo huấn luyện Lean Six Sigma c...
Áp dụng triển khai Lean Six Sigma Ngân Hàng
Lean Six Sigma Dành Riêng Cho Khối Ngân Hàng CiCC đã được VPBank lựa chọn là đối tác đào tạo huấn luyện Lean Six Sigma c...

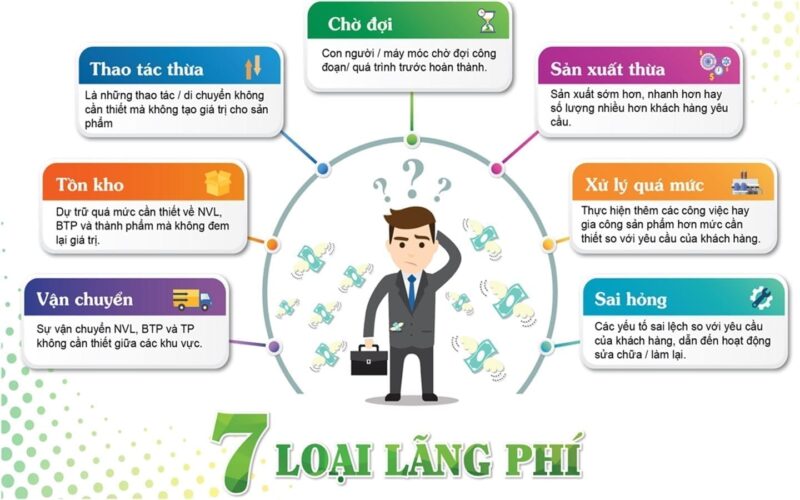
Các lãng phí waste (lean) trong dịch vụ công
Trong thời đại ngày nay, các nguyên tắc và phương pháp của hệ thống tinh gọn (LEAN) đã không còn chỉ áp dụng trong lĩnh ...
Đào tạo Six Sigma trong Ngân hàng
Lean Six Sigma là một phương pháp quản lý chất lượng đã được áp dụng thành công trong nhiều ngành công nghiệp, bao gồm c...
Lean Six Sigma Yellow Belt Ngân Hàng – VPBANK
Lean Six Sigma Dành Riêng Cho Khối Ngân Hàng CiCC đã được VPBank lựa chọn là đối tác đào tạo huấn luyện Lean Six Sigma c...
Lean Six Sigma Green Belt Dành Riêng Cho Khối Ngân Hàng
Lean dịch vụ ngân hàng, six sigma trong ngân hàng, khóa học nhận diện lãng phí trong dịch vụ ngân hàng Giới thiệu Chương...
📚 Tiếp tục khám phá
Nâng cao kiến thức với hệ sinh thái đào tạo và ứng dụng thực tế