đạo tạo six sigma ngân hàng

ỨNG DỤNG LEAN SIX SIGMA TẠI NGÂN HÀNG LPBank
CiCC ĐỒNG HÀNH CÙNG LPBANK TRIỂN KHAI CHƯƠNG TRÌNH LEAN SIX SIGMA CHAMPION CHO CÁN BỘ QUẢN LÝ 📢 Hà Nội, tháng 01/2025 – ...

CHƯƠNG TRÌNH LEAN SIX SIGMA YELLOW BELT DÀNH CHO KHỐI NGÂN HÀNG TẠI TPBANK
Tư Vấn Six Sigma – Nâng Cao Chất Lượng & Giảm Biến Động Quy Trình 3.4 PPM | CiCC
Giới thiệu Dịch vụ Tư vấn Six Sigma – CiCC Dẫn Dắt Hiệu Suất Đột Phá Trong bối cảnh toàn cầu hóa và cạnh tranh ngày càng...

Lean Ngân Hàng
Lean Six Sigma là một phương pháp quản lý chất lượng đã được áp dụng thành công trong nhiều ngành công nghiệp, bao gồm c...

Cp Cpk Pp Ppk là gì
Năng lực quá trình là gì? PROCESS CAPABILITY Cp Cpk
Chỉ số khả năng của quá trình, hay tỷ l...
Tại sao Ngân hàng nên Áp dụng Lean Six Sigma?
Lean Six Sigma là một phương pháp quản lý chất lượng đã được áp dụng thành công trong nhiều ngành công nghiệp, bao gồm c...
Lean Six Sigma Yellow Belt Ngân Hàng – VPBANK
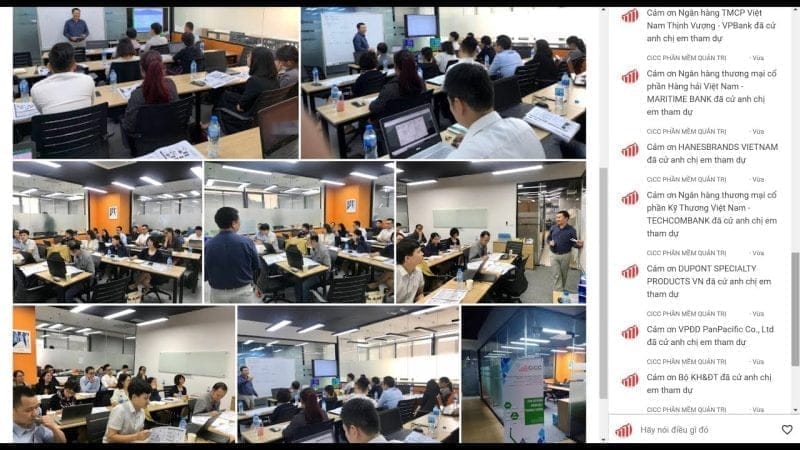
Lean Six Sigma Dành Riêng Cho Khối Ngân Hàng CiCC đã được VPBank lựa chọn là đối tác đào tạo huấn luyện Lean Six Sigma c...
Áp dụng triển khai Lean Six Sigma Ngân Hàng
Lean Six Sigma Dành Riêng Cho Khối Ngân Hàng CiCC đã được VPBank lựa chọn là đối tác đào tạo huấn luyện Lean Six Sigma c...
Đào tạo Six Sigma trong Ngân hàng
Lean Six Sigma là một phương pháp quản lý chất lượng đã được áp dụng thành công trong nhiều ngành công nghiệp, bao gồm c...
Lean Six Sigma Yellow Belt Ngân Hàng – VPBANK
Lean Six Sigma Dành Riêng Cho Khối Ngân Hàng CiCC đã được VPBank lựa chọn là đối tác đào tạo huấn luyện Lean Six Sigma c...
Lean Six Sigma Green Belt Dành Riêng Cho Khối Ngân Hàng
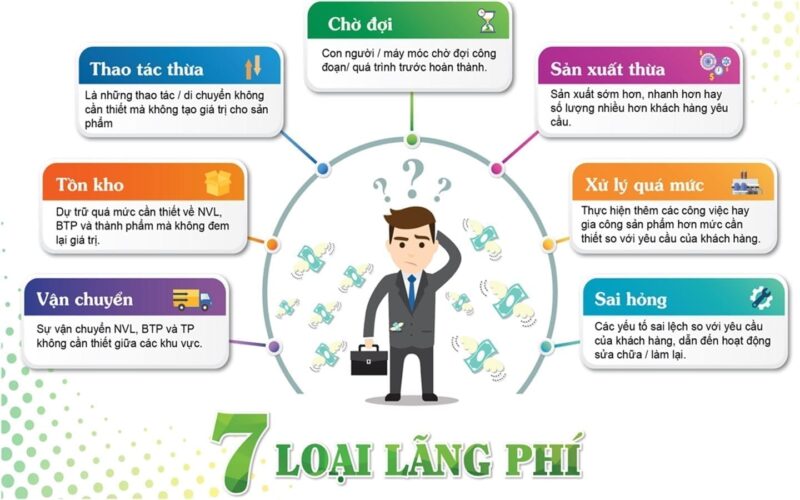
Lean dịch vụ ngân hàng, six sigma trong ngân hàng, khóa học nhận diện lãng phí trong dịch vụ ngân hàng Giới thiệu Chương...

Khóa học Lean Six Sigma trong Dịch vụ Ngân hàng ANZ Việt Nam
Lean Six Sigma là một phương pháp quản lý chất lượng đã được áp dụng thành công trong nhiều ngành công nghiệp, bao gồm c...
Bạn Muốn Tìm Hiểu Thêm?
Liên hệ CiCC để được tư vấn giải pháp cải tiến phù hợp nhất cho doanh nghiệp
📚 Tiếp tục khám phá
Nâng cao kiến thức với hệ sinh thái đào tạo và ứng dụng thực tế